Python – Performing operations on the stock data
Last Updated :
02 Sep, 2020
This article demonstrates basic operations that can be done using Python to analyze and construct algorithmic trading strategies on stock data. We run through some simple operations that can be performed using Python on stock data, and we begin by reading stock data from a CSV file. Python has emerged as the fastest-growing programming language and this stems from multiple factors such as ease of learning, readability, conciseness, a large group of developers, application across domains, etc. Python has also found broad adoption in trading and this has led to the growth of Python-based analytics tools, Python APIs, and trading strategies using Python.
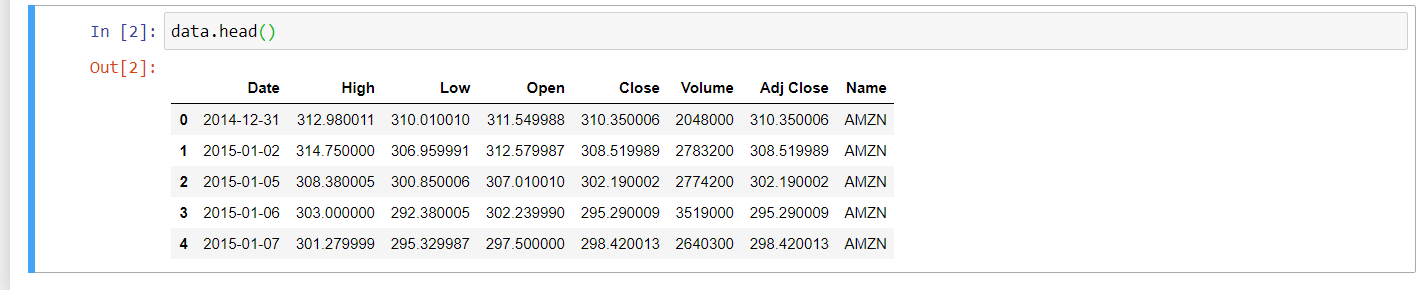
This post aims to illustrate how easy it is to learn and apply Python to formulate and analyze trading strategies. If you’re new to programming this blog you may just be helping to conquer your programming anxiety. Python comes with the built-in DateTime module to handle the dates and times. It comes with different functions to control the dates and times, as you probably guessed. We can easily parse any date-time string using this module, and convert it to a DateTime object. Let’s run through some simple operations which can be done using Python on stock info. We begin by reading the data from a CSV file on the stock. The CSV file contains the stock numbers Open-High-Low-Close (OHLC) and Volume.
Code:
import pandas as pd
data = pd.read_csv('YourFileName.csv', index_col ="Date", parse_dates = True)
data.head()
|
Parsing allows us to access data by just mentioning the date or month
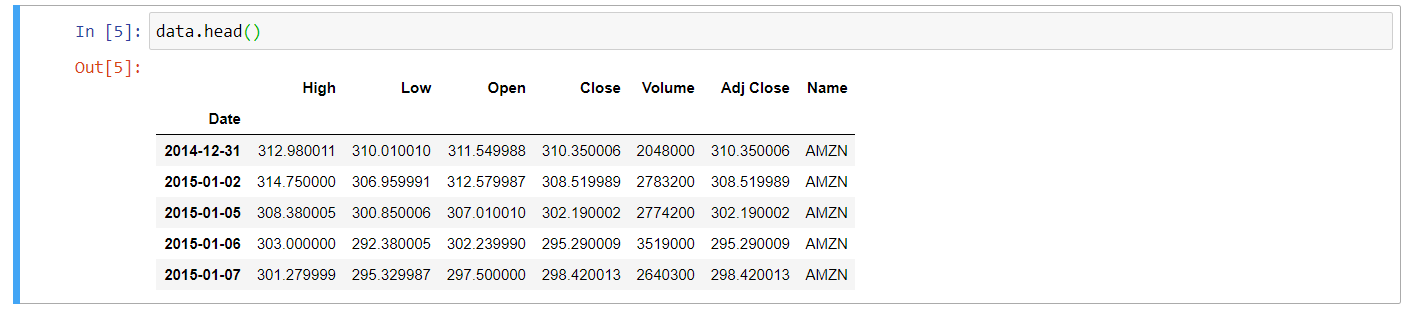
Dataframe after parsing date
Determine if the object is a DateTime index for pandas using
type()function.
Code:

Dataframe is a DateTime index
If you want to know the number of trading days (number of rows) in the given set of data, it can be done using the
count() method.
Code:

No. of rows in a Dataframe.
What is the highest close price achieved over the given period? This is made possible by the use of the
max() method.
Code:
maximum_price = data['Close'].max()
print(maximum_price)
|

Maximum Price
Is it possible to know the date this maximum price was reached on as well? We apply
index property as shown below to find the respective date.
Code:
data.Close[data.Close == maximum_price].index
|

The maximum price of the stock was crossed on 30th April 2020
Let’s calculate the change in percentage in closing price per day. We ‘re adding a new ‘Daily_Change’ column to our existing data set. We use
pct_change() method to calculate daily returns.
Code:
data['Daily_Change'] = data['Close'].pct_change()*100
data.head()
|
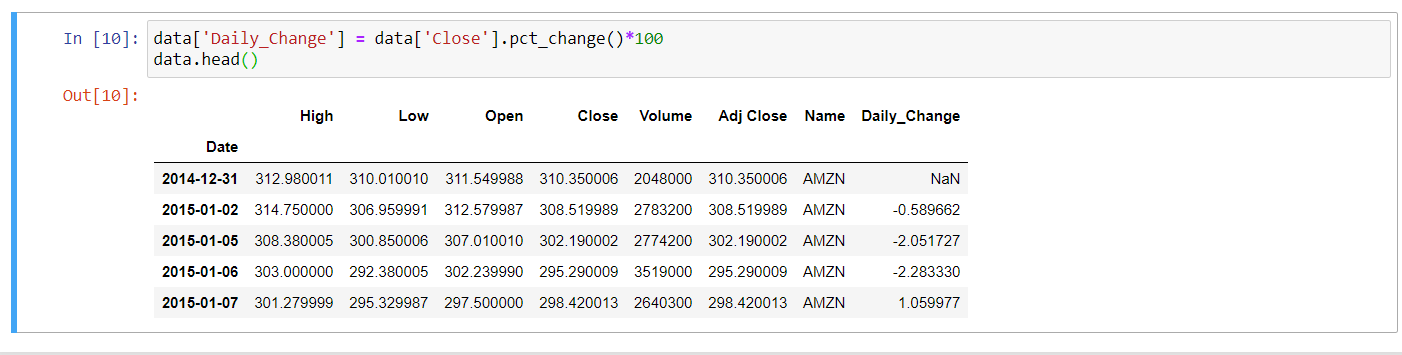
Daily returns of the stock
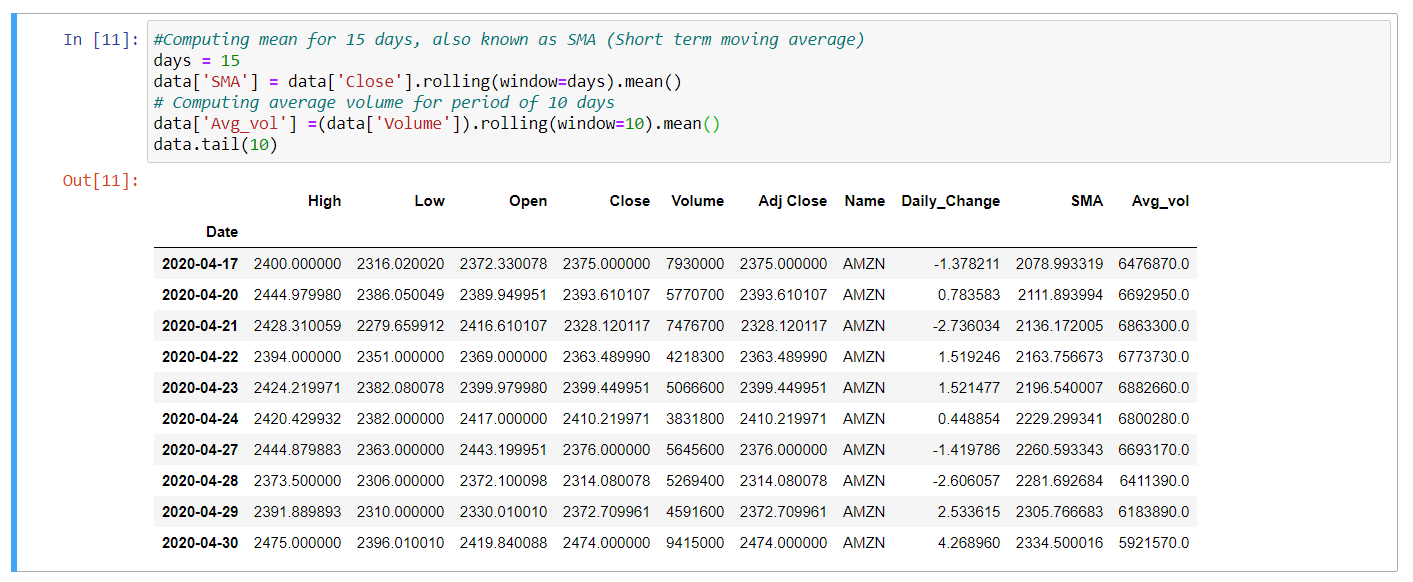
In the end, let’s add a few indicators. We measure the simple moving average of 15 days, and the average volume of 10 days. We will add more measures to our data frame and then evaluate the trend in stocks to see whether it is bullish or bearish.
Code:
days = 15
data['SMA'] = data['Close'].rolling(window = days).mean()
data['Avg_vol'] =(data['Volume']).rolling(window = 10).mean()
data.tail(10)
|
We covered a few easy ways in this short post to evaluate the data set and develop greater understanding of stock data. Can you consider constructing a trade strategy using specific basic operations and simple indicators? Simple trading strategies can be efficient and this can be assured by many active traders.
Share your thoughts in the comments
Please Login to comment...