How to Download historical stock prices in Python ?
Last Updated :
05 Apr, 2021
Stock prices refer to the current price of the share of that stock. Stock prices are widely used in the field of Machine Learning for the demonstration of the regression problem. Stock prediction is an application of Machine learning where we predict the stocks of a particular firm by looking at its past data. Now to build something like this first step is to get our historical stock data.
We can get our historical stock data using API’s provided as library support in Python. A few of the API’s are mentioned below:
- Yahoo Finance
- Pandas DataReader
- Quandl
Approach:
Each of the methods uses a different python module, but they have a similar procedural structure which includes the following steps:
1. Import required libraries
- We are using datetime module to get the date of the starting and ending limit of the stock data required.
- We are using matplotlib module to display the data extracted in a graphical format.
2. Initialize the start and end date for getting the stock data during that time period.
3. Get the data using the dedicated functions provided in each of the modules.
4. Display the data using the matplotlib library. We use the plot() function to plot the data in a graphical format.
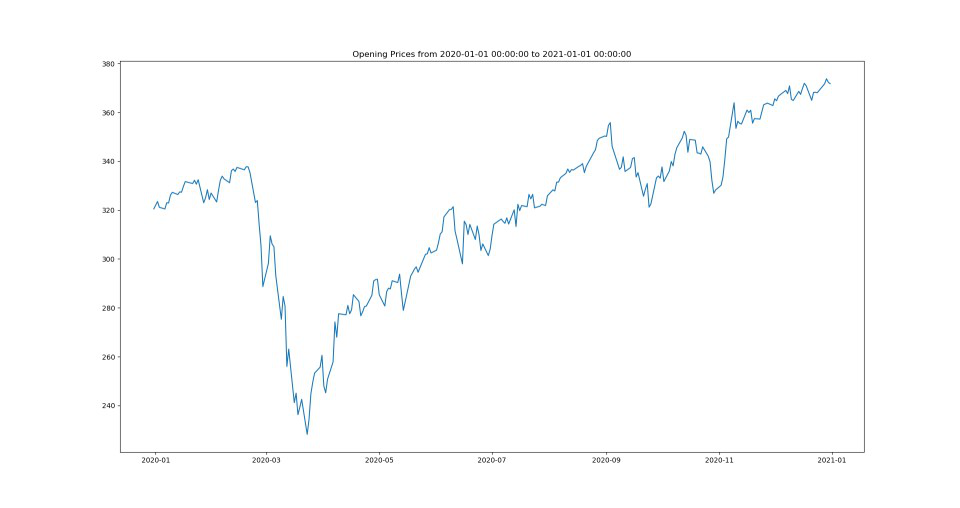
Method 1: Using Yahoo Finance
We can get stock using the yfinance.download() function provided in the yfinance module which is a module for Yahoo’s Finance API. We can download the module using the following command.
pip install yfinance
We need to supply 3 required parameters in the yfinance.download() function which are
- Stock Symbol
- Start date
- End date
Below is the implementation.
Python3
from datetime import datetime
import yfinance as yf
import matplotlib.pyplot as plt
start_date = datetime(2020, 1, 1)
end_date = datetime(2021, 1, 1)
data = yf.download('SPY', start = start_date,
end = end_date)
plt.figure(figsize = (20,10))
plt.title('Opening Prices from {} to {}'.format(start_date,
end_date))
plt.plot(data['Open'])
plt.show()
|
Output:
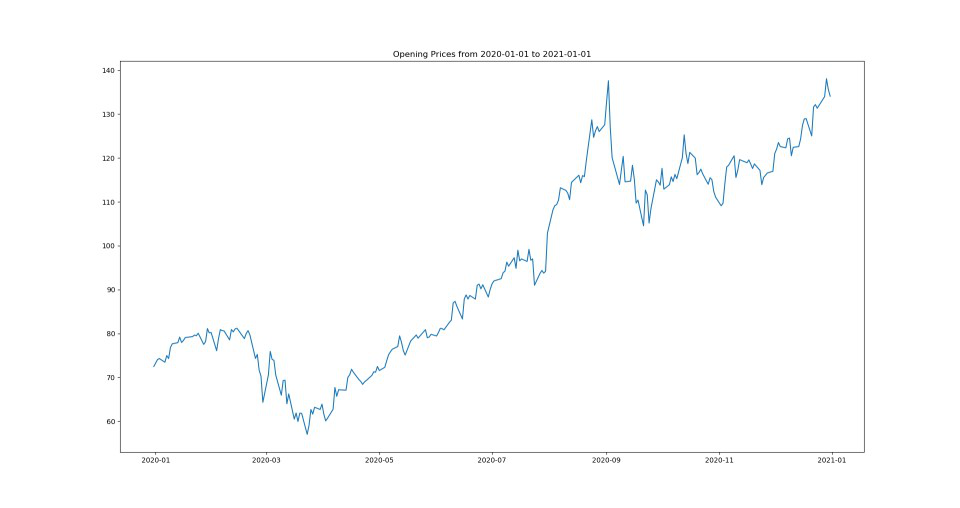
Method 2: Using Pandas DataReader
Another way of getting the historical stock data is to use the pandas_datareader library. It also uses Yahoo’s Finance API to load in the data. We can download the module using the following command.
pip install pandas_datareader
It also requires the similar three fields to load in the data which are
- Stock Symbol
- Start date
- End date
Below is the implementation:
Python3
from pandas_datareader import data as pdr
import matplotlib.pyplot as plt
start = "2020-01-01"
end = "2021-01-01"
symbols = ["AAPL"]
data = pdr.get_data_yahoo(symbols, start, end)
plt.figure(figsize = (20,10))
plt.title('Opening Prices from {} to {}'.format(start, end))
plt.plot(data['Open'])
plt.show()
|
Output:
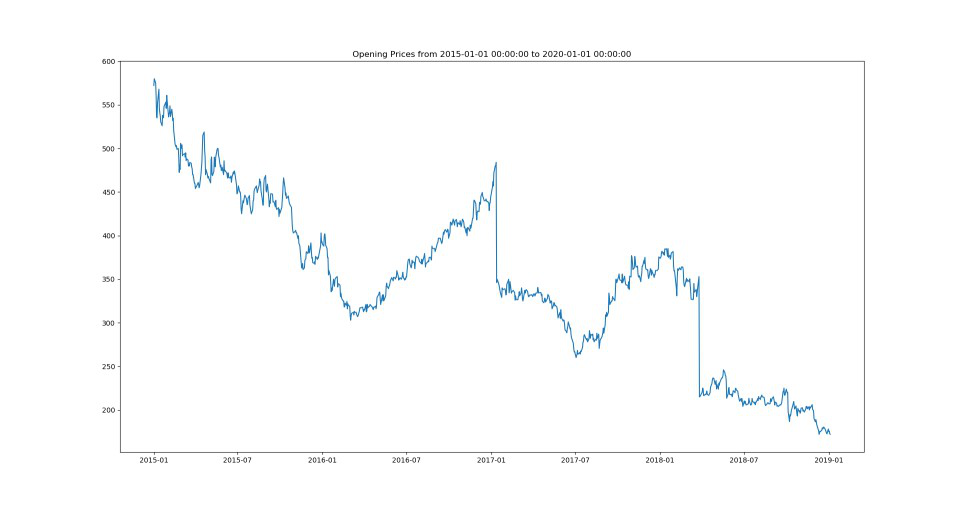
Method 3: Using Quandl
Quandl has hundreds of free and paid data sources, across equities, fixed incomes, commodities, exchange rates, etc. In order to get the access, we need to create an account on Quandl and get an API Key to access the data for free. After that, we need to download the API support quandl library of python using the following command.
pip install quandl
We will use quandl.get() function to get the data. It takes four fields to load in the data
- Symbol
- start_date
- end_date
- Authentication token
Below is the implementation:
Python3
import quandl
from datetime import datetime
import matplotlib.pyplot as plt
start = datetime(2015, 1, 1)
end = datetime(2020, 1, 1)
df = quandl.get('NSE/OIL', start_date = start,
end_date = end,
authtoken = 'enter_your_api_key')
plt.figure(figsize=(20,10))
plt.title('Opening Prices from {} to {}'.format(start, end))
plt.plot(df['Open'])
plt.show()
|
Output:
Like Article
Suggest improvement
Share your thoughts in the comments
Please Login to comment...