Python – Convert Tick-by-Tick data into OHLC (Open-High-Low-Close) Data
Last Updated :
17 Jul, 2020
In this post, we’ll explore a Python pandas package feature. We frequently find queries about converting tick-by-tick data to OHLC (Open, High, Low and Close). Using pandas kit this can be done with minimum effort. The OHLC data is used over a unit of time (1 day, 1 hour etc.) to perform a technical analysis of price movement.
The First Step:
The first step relates to the collection of sample data. Let’s import tick sample tick by tick data. We will use the January data for AUD / JPY (Australian Dollar / Japanese Yen) pair which was downloaded from Pepperstone (an external source) for this tutorial.
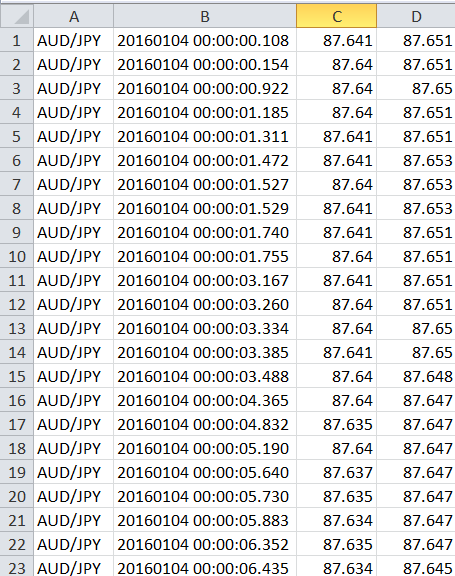
Pepperstone offers free historical tick data for specific pairs of currencies. The.csv file contains top of the book, tick-by-tick market data, with millisecond details of fractional pip spreads. For our study, the data is more than adequate.
Steps in Python:
As you can see there is no header to the data. We’ll include the header and programmatically accomplish the necessary mission.
Code: Importing pandas package.
Code: Loading the data.
data_frame = pd.read_csv(
'AUDJPY-2016-01.csv', names=['Symbol', 'Date_Time', 'Bid', 'Ask'],
index_col=1, parse_dates=True)
data_frame.head()
|
Data is stored with the name ‘AUDJPY-2016-01.csv’ in the working directory. As we saw earlier, there is no header to the data. We will then add a header to the data when importing it. Importing and adding headers thus occurs in the same line of code.
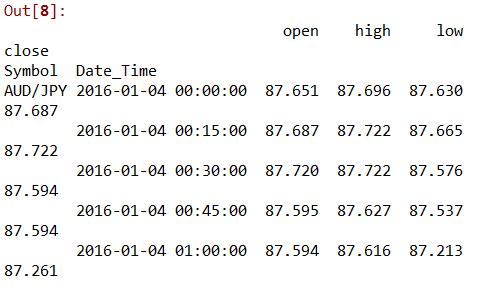
The resample attribute of a data frame for pandas is used. The resample feature allows standard time-series data to be re-examined. For 15 minutes, we must resample the data and partition it into OHLC format. Using L for milliseconds, U for microseconds, and S for seconds if you want to resample for smaller time frames (milliseconds/microseconds/seconds), etc.
data_ask = data_frame['Ask'].resample('15Min').ohlc()
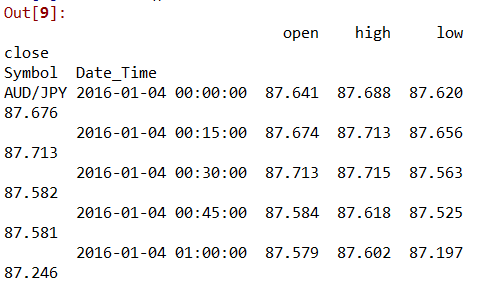
data_bid = data_frame['Bid'].resample('15Min').ohlc()
|
Code: ‘Ask’ Dataframe
 Code: ‘Bid’ Dataframe
Code: Merging of ‘ask’ and ‘bid’ dataframe
data_ask_bid = pd.concat(
[data_ask, data_bid], axis=1,
keys=['Ask', 'Bid'])
|
Conclusion:
This is a fast way of using TBT data to compute the OHLC. This can be applied across assets, and based on the OHLC data, one can devise various strategies. We can also plot OHLC-based maps, and generate trade signals. Another way to use the data is to build technical indicators in python, or to calculate risk-adjusted returns.
Share your thoughts in the comments
Please Login to comment...