Python Bokeh – Colors Class
Last Updated :
28 Jul, 2020
Bokeh is a Python interactive data visualization. It renders its plots using HTML and JavaScript. It targets modern web browsers for presentation providing elegant, concise construction of novel graphics with high-performance interactivity.
In this article, we will learn about colors in Bokeh. There are 5 different classes for colors in Bokeh :
- bokeh.colors.Color
- bokeh.colors.HSL
- bokeh.colors.RGB
- bokeh.colors.groups
- bokeh.colors.names
bokeh.colors.Color
This is the base class representing the color objects. The methods in this class are :
- clamp()
- copy()
- darken()
- from_hsl()
- from_rgb()
- lighten()
- to_css()
- to_hsl()
- to_rgb()
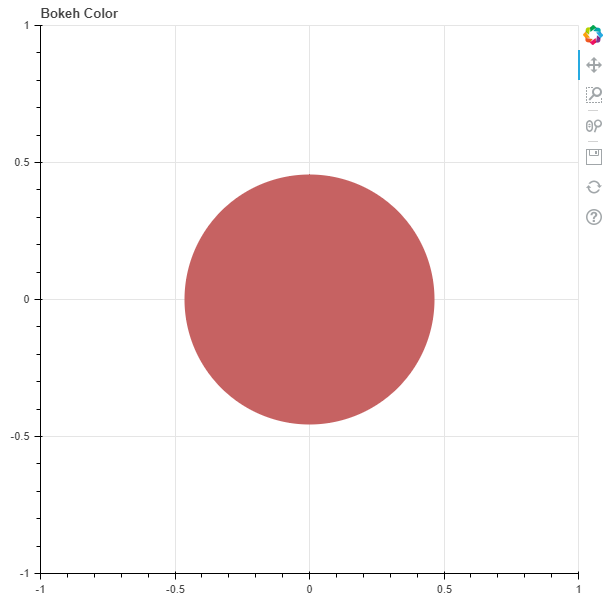
bokeh.colors.HSL
This provides a class to represent colors with HSL format, i.e. Hue, Value and Lightness.
Example : We will plot a glyph and use the HSL format to color it.
Python3
from bokeh.plotting import figure, output_file, show
from bokeh.colors import HSL
output_file("gfg.html")
graph = figure(title = "Bokeh Color")
x = 0
y = 0
hue = 0
saturation = 0.47
lightness = 0.58
color = HSL(h = hue,
s = saturation,
l = lightness)
graph.dot(x, y, size = 1000,
color = color.to_rgb())
show(graph)
|
Output :
bokeh.colors.RGB
This represents colors by specifying their Red, Green, and Blue channels.
Example : We will plot a glyph and use the RGB format to color it in light green.
Python3
from bokeh.plotting import figure, output_file, show
from bokeh.colors import RGB
output_file("gfg.html")
graph = figure(title = "Bokeh Color")
x = 0
y = 0
red = 144
green = 238
blue = 144
color = RGB(r = red,
g = green,
b = blue)
graph.dot(x, y, size = 1000,
color = color)
show(graph)
|
Output :

bokeh.colors.groups
This represents CSS named colors into useful groups according to the general hue. Each color has its own class with multiple colors of different hues. The list of colors present in this class are :
- black : gainsboro, lightgray, silver, darkgray, gray, dimgray, lightslategray, slategray, darkslategray, black
- blue : lightsteelblue, powderblue, lightblue, skyblue, lightskyblue, deepskyblue, dodgerblue, cornflowerblue, steelblue, royalblue, blue, mediumblue, darkblue, navy, midnightblue
- brown : cornsilk, blanchedalmond, bisque, navajowhite, wheat, burlywood, tan, rosybrown, sandybrown, goldenrod, darkgoldenrod, peru, chocolate, saddlebrown, sienna, brown, maroon
- cyan : mediumaquamarine, aqua, cyan, lightcyan, paleturquoise, aquamarine, turquoise, mediumturquoise, darkturquoise, lightseagreen, cadetblue, darkcyan, teal
- green : darkolivegreen, olive, olivedrab, yellowgreen, limegreen, lime, lawngreen, chartreuse, greenyellow, springgreen, mediumspringgreen, lightgreen, palegreen, darkseagreen, mediumseagreen, seagreen, forestgreen, green, darkgreen
- orange : orangered, tomato, coral, darkorange, orange
- pink : pink, lightpink, hotpink, deeppink, palevioletred, mediumvioletred
- purple : lavender, thistle, plum, violet, orchid, fuchsia, magenta, mediumorchid, mediumpurple, blueviolet, darkviolet, darkorchid, darkmagenta, purple, indigo, darkslateblue, slateblue, mediumslateblue
- red : lightsalmon, salmon, darksalmon, lightcoral, indianred, crimson, firebrick, darkred, red
- white : white, snow, honeydew, mintcream, azure, aliceblue, ghostwhite, whitesmoke, seashell, beige, oldlace, floralwhite, ivory, antiquewhite, linen, lavenderblush, mistyrose
- yellow : yellow, lightyellow, lemonchiffon, lightgoldenrodyellow, papayawhip, moccasin, peachpuff, palegoldenrod, khaki, darkkhaki, gold
Example : We will plot multiple glyphs and use the color groups to color them.
Python3
from bokeh.plotting import figure, output_file, show
from bokeh.colors.groups import purple, yellow, blue
output_file("gfg.html")
graph = figure(title = "Bokeh Color")
x = [-2, 0, 2]
y = 0
color = [purple()._colors[purple()._colors.index("Fuchsia")],
yellow()._colors[yellow()._colors.index("Khaki")],
blue()._colors[blue()._colors.index("RoyalBlue")]]
graph.dot(x, y, size = 1000,
color = color)
show(graph)
|
Output :

bokeh.colors.named
This class provides us with all the 147 CSS named colors.
Example : We will plot multiple glyphs and use the color names to color them.
Python3
from bokeh.plotting import figure, output_file, show
from bokeh.colors import named
output_file("gfg.html")
graph = figure(title = "Bokeh Color")
x = [-3, 0, 3]
y = 0
color = ["bisque",
"greenyellow",
"magenta"]
graph.dot(x, y, size = 1000,
color = color)
show(graph)
|
Output :

Share your thoughts in the comments
Please Login to comment...