Python | Adding markers to volcano locations using folium package
Last Updated :
08 Mar, 2024
Python is a multipurpose language and its utilities extend to more than just normal programming. It can be used to develop games, crawl the internet, or develop deep learning models.
We’ll be using the Python library named folium (with Pandas) along with the Volcanoes_USA dataset (which contains the necessary data used in this project). The script will create a saved web page. Upon opening it the user will be directed to google maps, where the locations of the volcanoes will be marked, their colors set according to the elevation.
Setup:
First, Install libraries like folium, pandas, and the dataset mention above:
pip3 install folium
pip3 install pandas
Now, you need to download the required dataset, Volcanoes_USA.txt. Remember to download this in the same directory in which you will save the Python script. Also, do remove the apostrophes “‘” from the values of the ‘NAME’ column in the dataset, wherever present.
Pre-defined functions:
- Mean() – A pandas function which can calculate the mean of the values of in an array/Series.
- Map() – Generate a base map of given width and height with either default tilesets or a custom tileset URL.
- Marker() – Create a simple stock Leaflet marker on the map, with optional popup text or Vincent visualization.
User defined functions :
- color() – used to assign color to the marker according to the elevation of volcano.
Below is the implementation:
Python3
import folium
import pandas as pd
df=pd.read_csv('Volcanoes.txt')
latmean=df['LAT'].mean()
lonmean=df['LON'].mean()
map5 = folium.Map(location=[latmean,lonmean],
zoom_start=6,tiles = 'Mapbox bright')
def color(elev):
if elev in range(0,1000):
col = 'green'
elif elev in range(1001,1999):
col = 'blue'
elif elev in range(2000,2999):
col = 'orange'
else:
col='red'
return col
for lat,lan,name,elev in zip(df['LAT'],df['LON'],df['NAME'],df['ELEV']):
folium.Marker(location=[lat,lan],popup = name,
icon= folium.Icon(color=color(elev),
icon_color='yellow',icon = 'cloud')).add_to(map5)
print(map5.save('test7.html'))
|
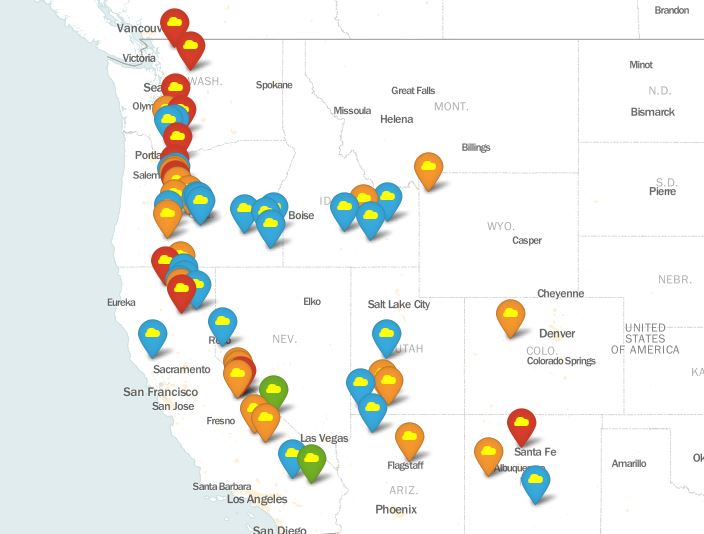
Output:
Reference:
http://python-visualization.github.io/folium/docs-v0.5.0/modules.html
Share your thoughts in the comments
Please Login to comment...