Emojis as markers in Matplotlib
Last Updated :
06 May, 2021
Prerequisite: Matplotlib
When we plot graphs, quite often there’s a need to highlight certain points and show them explicitly. This makes our demonstration more precise and informative. It can be achieved with the use of markers. Markers in Matplotlib are a way to emphasize each point that is plotted. They are nothing but ‘plotted points’ which can be used with a graph plot, scatter plot, etc. in different colors, shapes, and sizes. Instead of using the traditional markers, we will see how we can use emojis as markers in our graph.
We will discuss the following two ways used to add emojis as markers:
- Using Unicode Characters
- Using OffsetImage inside AnnotationbBox
Using Unicode Characters
Unicode is a standard for the consistent encoding and handling of text, numbers, etc. We can also represent emojis through Unicode characters. For example, a grinning face can be represented through U+1F600. Unicode can be implemented by different character encodings like UTF-8, UTF-16, and UTF-32. In this example, we use the UTF-8 encoding system.
Approach:
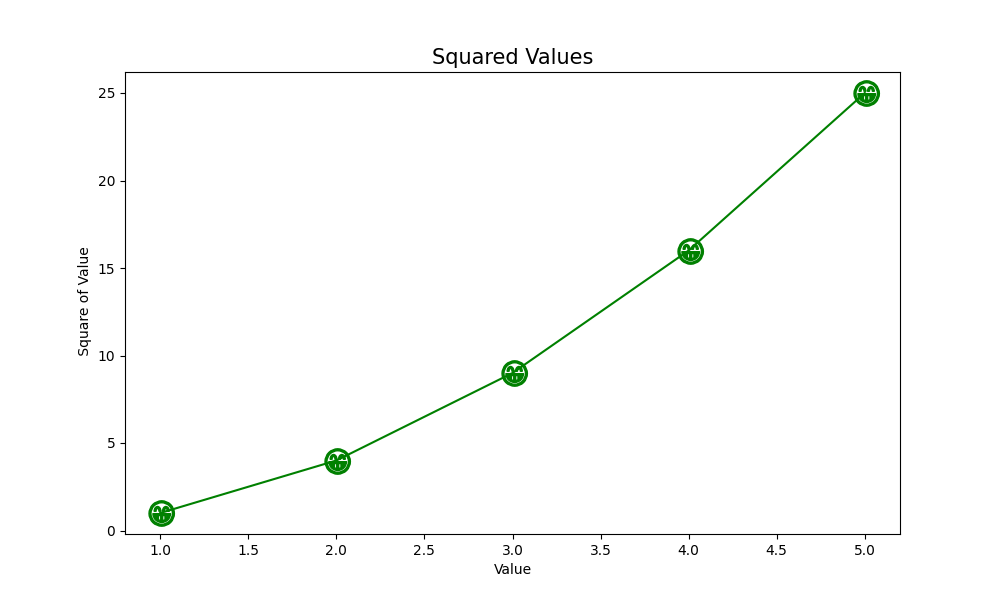
In the example given below, we plot the squared values for the given list of numbers on graphs. The x_values is a list of numbers from 1 to 5 and y_values is another list consisting of squared values of each number in the list x_values.
- The matplotlib.pyplot.subplots() function in the pyplot module of the matplotlib library is used to create a figure and a set of subplots. Although it takes a number of parameters, for simplicity we only specify the figure size. It returns a tuple (fig, ax) giving a single figure fig with an array of axes ax.
- The ax.plot() takes a list of x and y values, marker, marker size (ms), and color (c). Note that there’s a dollar($) sign before and after the Unicode characters while specifying the marker. One can easily find Unicode characters for the emojis they wish to.
- Finally, using ax.set(), we set the title, x, and y labels.
- The plt.show() displays the graph on the screen.
Example:
Python3
import matplotlib.pyplot as plt
x_values = [1, 2, 3, 4, 5]
y_values = [x*x for x in x_values]
fig, ax = plt.subplots(figsize=(10, 6))
ax.plot(x_values, y_values, marker='$\U0001F601$', ms=20, c='green')
ax.set_title('Squared Values', fontsize=15)
ax.set_xlabel('Value')
ax.set_ylabel('Square of Value')
plt.show()
|
Output:
Using OffsetImage inside AnnotationbBox
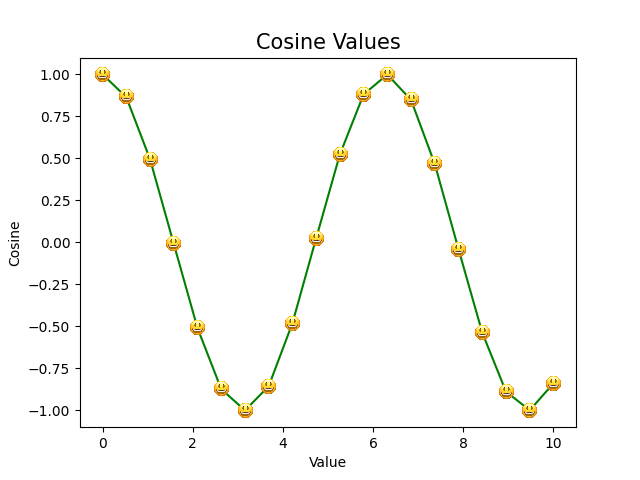
Annotation of points with text is often used while plotting graphs. However, we can also annotate the points using images. Any emoji image can be used as an annotation using the OffsetImage and AnnotationbBox. In the example given below, we have plotted the cosine values on a graph. An emoji is used as a marker for each point.
Approach:
- Like the previous example, we import all the necessary libraries.
- The np.linspace() returns evenly spaced numbers over a specified interval. It takes parameters: start value, end value, and the total number of values we want. Here we get 20 values between 0 and 10.
- The np.cos() returns the cosine of all the x_values.
- Using plt.imread(), the emoji image is read from a file into an array. It takes up the filename as a parameter.
- Through matplotlib.offsetbox(), we set our emoji image as the offsetImage. The parameters taken include the image and the zoom value. Setting the zoom value to a constant ensures that the size of the emoji remains the same even when the graph is magnified.
- The np.atleast_1d() converts inputs provided to arrays with at least one dimension. Passing x and y values returns arrays consisting of all of their values.
- The zip() function iterates through x and y values. We go through each value of x and its corresponding y values and create an annotation box. AnnotationBbox() function takes the offset box (image_box that we created) and the (x, y) value where the emoji is plotted. The frameon value is kept False to remove a square box surrounding the emoji.
- The Add_artist() method takes up the annotation box we created (ab) and then returns this added artist.
- Finally, we plot the graph using ax.plot() and set the colour to green.
- The plt.show() displays the graph on the screen.
Example:
Python3
import matplotlib.pyplot as plt
from matplotlib.offsetbox import OffsetImage, AnnotationBbox
import numpy as np
fig, ax = plt.subplots()
x = np.linspace(0, 10, 20)
y = np.cos(x)
ax.set_title('Cosine Values', fontsize=15)
ax.set_xlabel('Value')
ax.set_ylabel('Cosine')
image = plt.imread('emoji.png')
image_box = OffsetImage(image, zoom=0.1)
x, y = np.atleast_1d(x, y)
for x0, y0 in zip(x, y):
ab = AnnotationBbox(image_box, (x0, y0), frameon=False)
ax.add_artist(ab)
ax.plot(x,y, c='green')
plt.show()
|
Output:
Like Article
Suggest improvement
Share your thoughts in the comments
Please Login to comment...