Power BI – Page Level Filters
Last Updated :
16 Jan, 2023
When you run a Power BI report on the Power BI Service, the Pollutants pane is located rather inconspicuously on the right side of your screen. The Pollutants pane is collapsed by dereliction, but you can expand it by clicking it formerly. Once it’s expanded, you can resize it by clicking and dragging the left edge.
Filters in Power BI sort data and information grounded on some named criteria. That is, you can elect particular fields or values within fields and view only the information related to them. Power BI displays your data by refining data relevant to you. With a filter in Power BI, you can:
- Work with smaller parts of your data.
- Do calculations for particular groups of interest.
- Exclude “bad” data from data visualizations.
- Train and validate statistical models.
Page Filters applies filters to all its included illustrations. To use page level filter, you can use the option “filter on this page” from the filter pane. Page-level filters are incredibly helpful while preparing company-wide reports, wherein you can produce separate filters for separate pages of your Deals, Marketing, and Support.
Page-level filters only filter the info on a given page, making them useful for creating pages specializing in particular subsets of your data. for instance, you’ll use page-level filters to make one-page focus solely on revenue data, while the subsequent page focuses on expense data. Page-level filters operate within the context of the report-level filters, which suggests that a page-level filter cannot override a report-level filter. They also can’t be programmed to filter the data on other pages.
Application of Page-level Filters
Import data from Your Excel to Power BI:
Home Tab -> Get Data -> Choose Data which you want Example Excel
-> Select the file and Open -> Select The sheet and Load
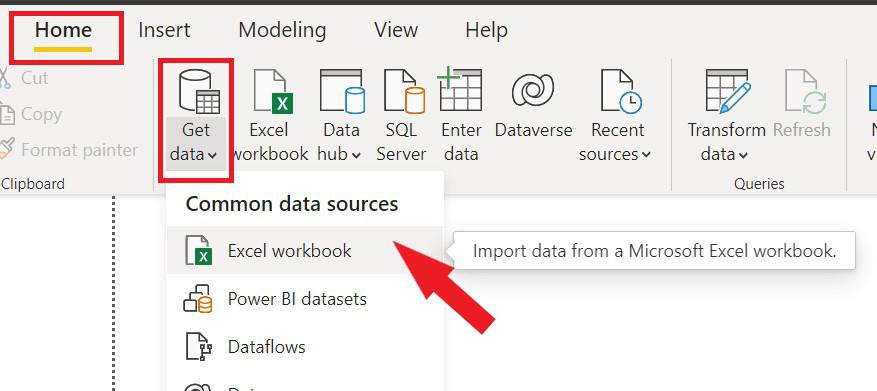
Importing Excel workbook in Power BI
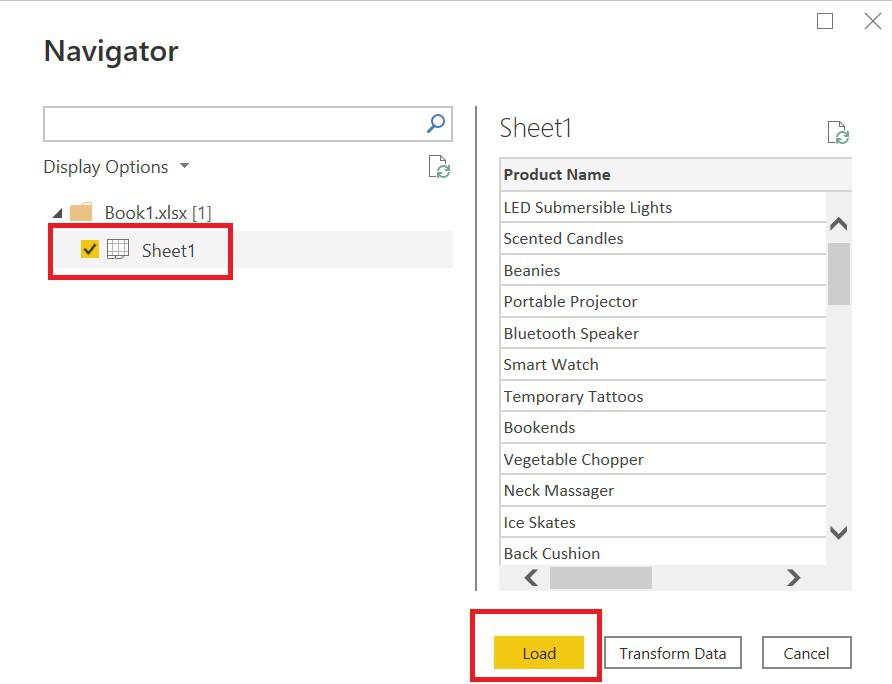
Loading Excel workbook in Power BI
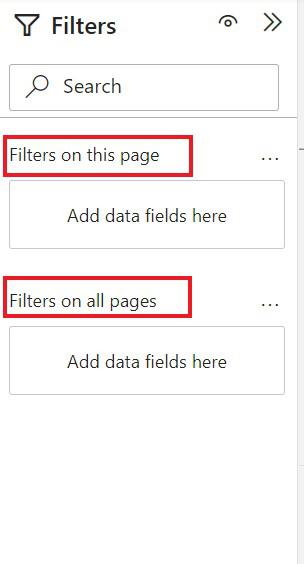
In the Filter Section, there are only two options:
- Filter on this page – it represents the Page level Filter
- Filter on all pages – it represents the Report level filter
Introduction to filters in Power BI
Creating a stack bar chart to demonstrate page-level filters:
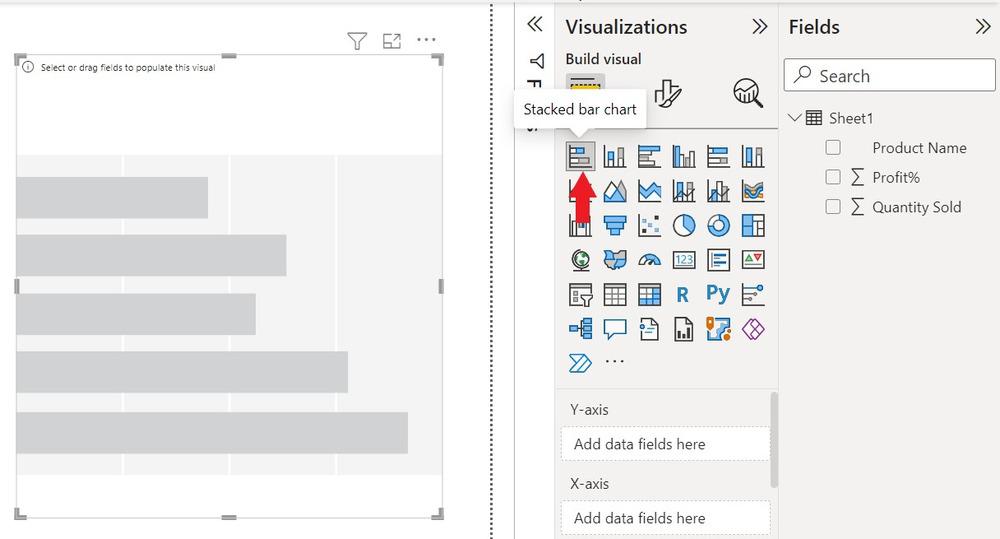
Creating Stacked Bar Chart in Power BI
To create a ‘Chart’ drag and drop the data under respective fields.
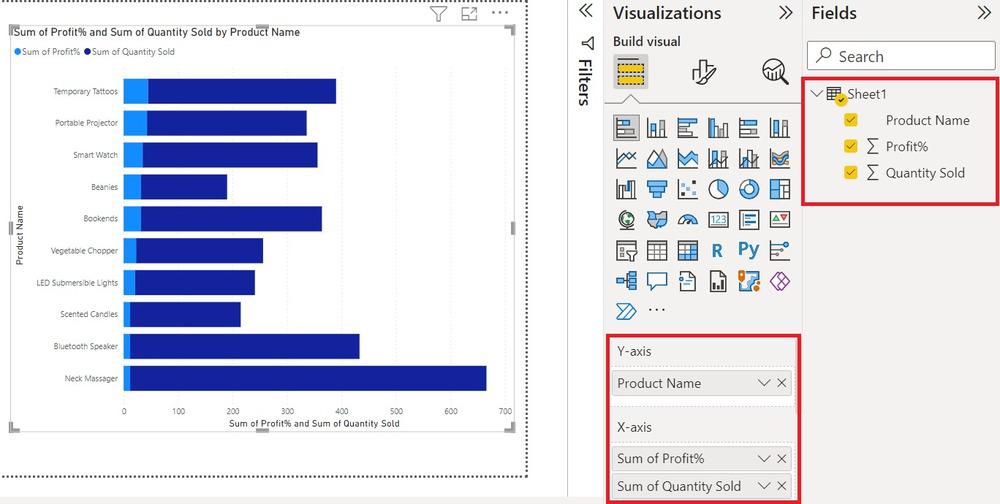
Adding values in the previous chart
To demonstrate Page level filter we create a table on the same page for a better explanation
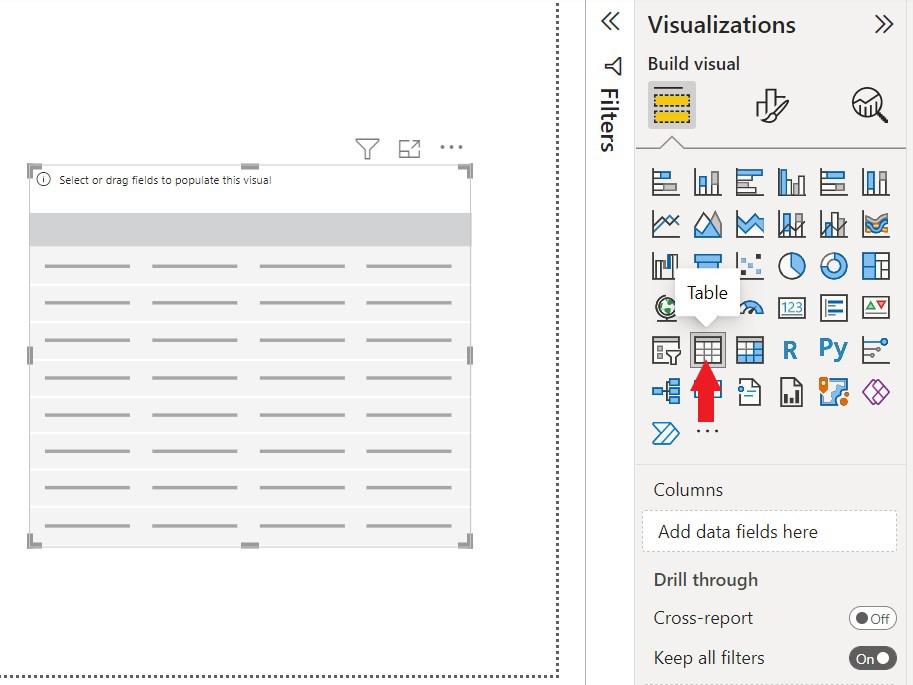
Creating a table in Power BI
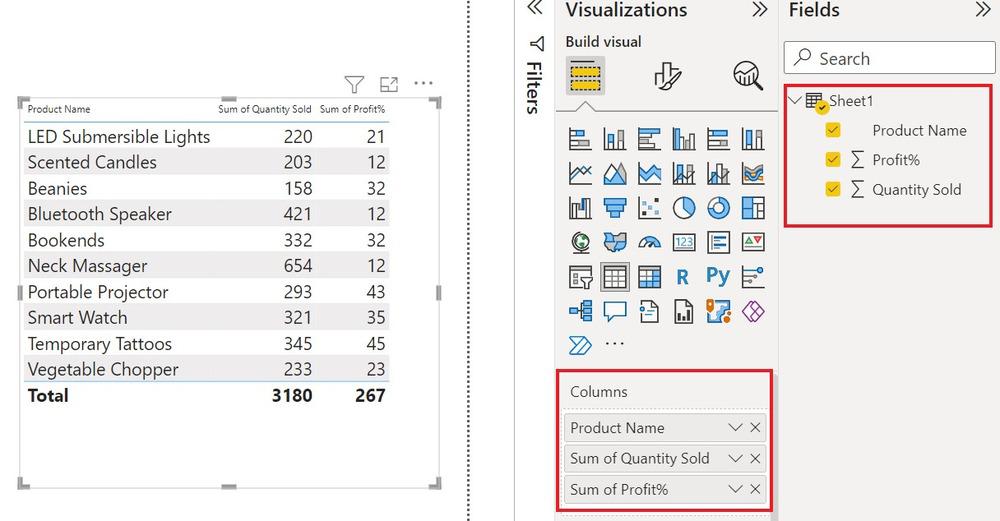
Populating table with values in Power BI
At this stage Power BI dashboard is shown below:
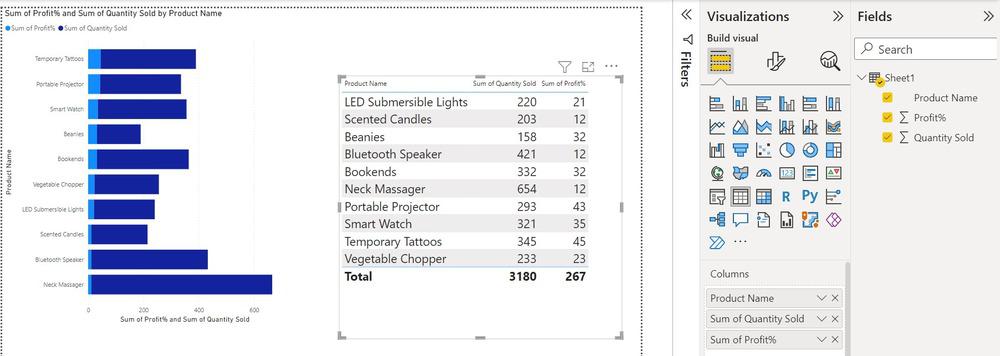
Stacked bar chart and table in Power BI
To use a page-level filter drag and drop the field under the page filter
To look for a particular product sold:
Filter on this Page -> Product Name-> Filter type -> Base Filtering -> Select the product
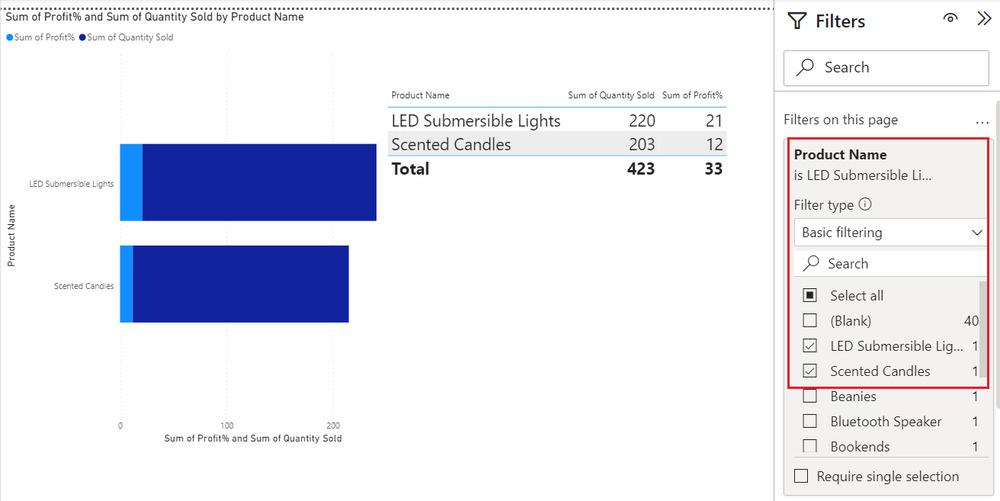
Apply Basic Filtering on all the reports of a page
To apply conditional Filtering ‘Advance Filtering’ used
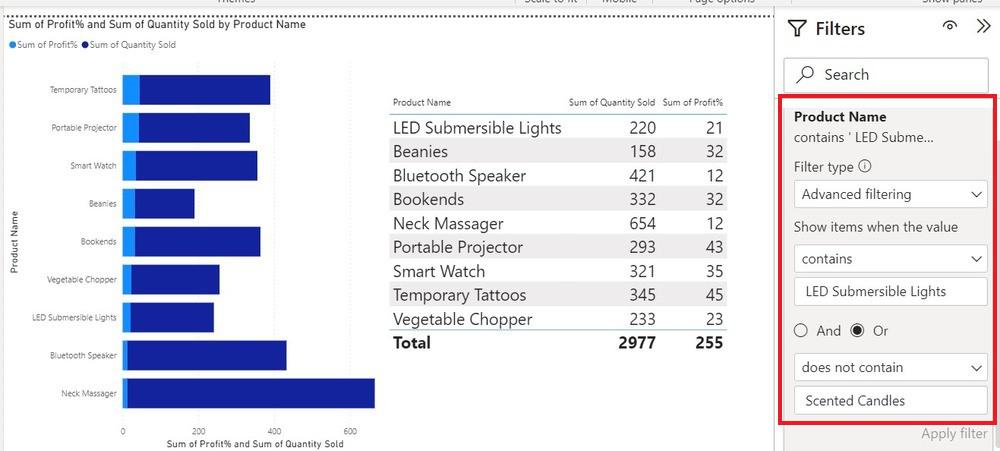
Apply Advanced Filtering on all the reports of a page
Play with data by loading the other fields on the page-level filters and try to understand the concept. Page-level filters are used for a specific page within a report. You’ll apply certain filter conditions on a selected page within a report using these filters. Moreover, each page during a report can have a different filter applied to it.
Share your thoughts in the comments
Please Login to comment...