Pearson Product Moment Correlation
Last Updated :
19 Mar, 2024
The Pearson product-moment correlation coefficient (or Pearson correlation coefficient) is a measure of the strength of a linear association between two variables and is denoted by r. Basically, a Pearson product-moment correlation attempts to draw a line of best fit through the data of two variables, and the Pearson correlation coefficient, r, indicates how far away all these data points are to this line of best fit (i.e., how well the data points fit this new model/line of best fit).
Coefficient of Correlation:
The correlation coefficient can be calculated as the covariance divided by the standard deviation of the variables. The following formula is used to calculate the Pearson correlation (r):
[Tex]r= \frac{\sum (x_i – \bar{x}) (y_i – \bar{y})}{\sqrt{\sum (x_i – \bar{x})^{2}\sum(y_i – \bar{y})^{2}}}[/Tex]
- r= coefficient of correlation
- x_bar = mean of x-variable
- y_bar = mean of y-variable.
- x_i, y_i = samples of variable x,y
The above value of the correlation coefficient can be between -1 and 1. A value close to 1 represents that perfect degree of association b/w the two variables and called a strong correlation and a value close to -1 represents the strong negative correlation. The value closer to 0 represents the weaker or no degree of correlation.
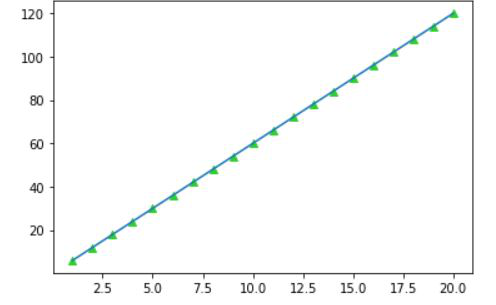
A strongly positive correlation (r=1)
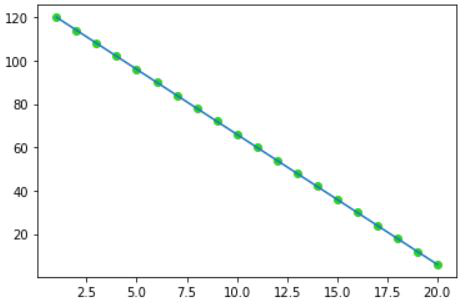
Strongly Negative Correlation (r=-1)
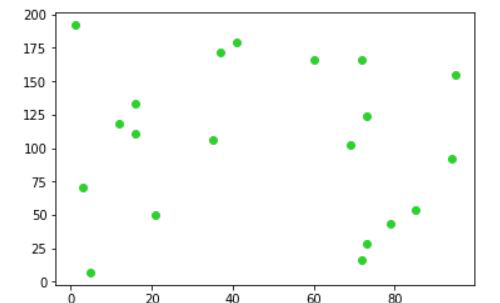
No correlation (r~=0)
Test of Significance:
A test of significance for the Pearson’s correlation coefficient may be used to find out if the computed Pearson correlation r could have significantly occurred in the population in which the two variables are significantly related or not. The test statistics follow t-distribution with N-2 degree of freedom. The significance is computed using the following formula
[Tex]t_{calc} = r\frac{\sqrt{N-2}}{\sqrt{1- r^{2}}}[/Tex]
While performing the test, we may assume following hypothesis:
- Null Hypothesis: The null hypothesis could be that there is no correlation b/w two variables at a given degree of significance. That is, the value of Pearson correlation coefficient is close to 0.
- Alternate Hypothesis: The alternate hypothesis hypothesize that the value of Pearson correlation coefficient is significantly different from 0. That is there may be some correlation b/w two variables.
Steps for performing the test:
- Set up the hypothesis.
- Decide the level of significance.
- Calculate the degree of freedom (df = N-2) and using that value determine the critical value of t from t-distribution table.
- Calculate Pearson’s correlation coefficient and calculate the value of t from the formula above.
- Determine whether to accept or reject the hypothesis
Implementation
Python3
# imports
import numpy as np
import scipy.stats as stats
import matplotlib.pyplot as plt

# define the variable
x = np.arange(1,11)
y = np.array([2, 1, 4, 5, 8, 12, 18, 25, 30, 27])

# plot the variables
plt.scatter(x,y)
plt.plot(x,y)

# the plot above represents a strong correlation.
correlation_coeff, p_value = stats.pearsonr(x,y)
# print pearson correlation coefficient
print(correlation_coeff)
# print p-value: the smallest level of significance that will be enough to reject H0
print(p_value)
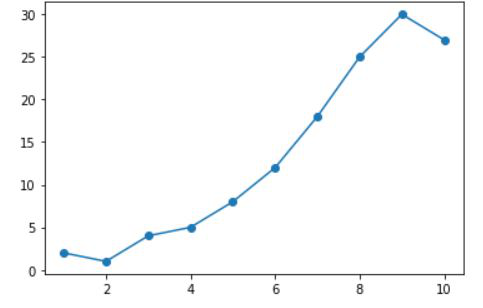
Line plot
# correlation coefficient
0.960576518918945
# p-value
1.0076332440506521e-05
Share your thoughts in the comments
Please Login to comment...