Monitor and Find Statistics for Linux Processes Using pidstat Tool
Last Updated :
22 Dec, 2022
Pidstat is a command-line tool and part of sysstat suite to monitor the Linux system. It is used to monitor every individual task currently being managed by the Linux kernel on the Linux system.
Features of pistat:
- It can monitor every task running on the system
- It can also monitor the child’s task of any task.
- It shows the total CPU usage by every task.
- It can monitor read and write data on disk by the task.
Now, let’s see how to install pidstat on the system. As we see before pidstat is part of sysstat suite therefore we need to install the sysstat on the system.
To install on Debian based system like ubuntu or kali Linux run the command:
sudo apt-get install sysstat
To install on systems like CentOS / Fedora / RHEL Linux run the command:
yum install sysstat
How to Use pidstat?
To monitor specific task running on a system run the pidstat with -p argument and after -p argument write the PID of taste but to monitor all current active task on the system we can use pidstat -p All command which is equivalent to just pidstat command, Now let’s see how will be the output of pistat to see active tasks run the following command on terminal:
pidstat
Output:
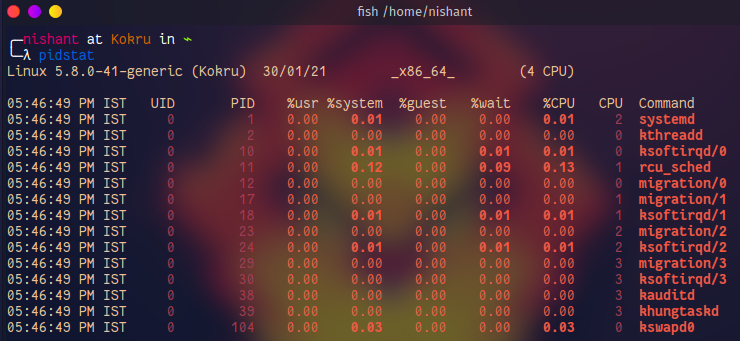
Tuple information:
The output shows the following information about the system:
- Kernel: Pidstat show which Linux kernel running on the system.
- CPU architecture: It shows the architecture of the CPU whether it is 64 bit or 32 bit.
- No. Of CPUs: This shows the total no. of processors in the system.
pidstat show the following common information about the tasks:
- UID: UID is a user identifier assigned by the Linux system to every user on the system. 0 UID is reserved for root.
- PID: PID is the process ID. This is a unique number assigned to every process running on the system by using PID system to identify the processes.
- %usr: Percentage of CPU usage by the process at the user level.
- %system: Percentage of CPU usage by the process at system level or kernel level
- %guest: Percentage of CPU usage by the process Percentage of CPU spent by the task in a virtual machine (running a virtual processor).
- %CPU: Total Percentage of CPU usage by that task.
- CPU: This field shows the processor number task on which that task is running.
- Command: The filed shows the command name of that task.
Now let’s see some options or arguments we can use with pidstat. The following are the arguments we can use with pistat:
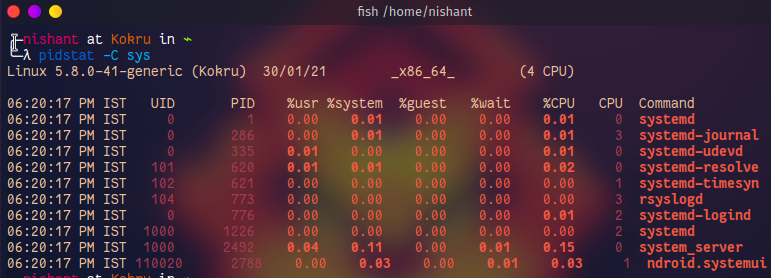
1) -C string: This argument shows the tasks which contain the given string in their command name. To use the -C option with the pidstat run the following command:
pidstat -C string
The following image shows the output of pidstat with the -C option and sys as a string. We can see that this output contains tasks that contain sys in their command name.
2) -d: This option shows the output similar to pidstat command but with some different information about the system. To use the -d option on the system use the following command.
pidstat -d
The following image shows the output of the command :
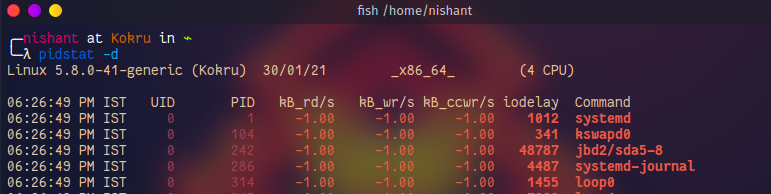
Let’s see what are the different terms:
- kB_rd/s: Number of kilobytes the task has caused to be read from disk per second.
- kB_wr/s: Number of kilobytes the task has caused to be written to disk per second
- kB_ccwr/s: Number of kilobytes whose writing to disk has been cancel by the task
3) -w: This is the argument that shows the task switching activity of tasks following is the output of the command
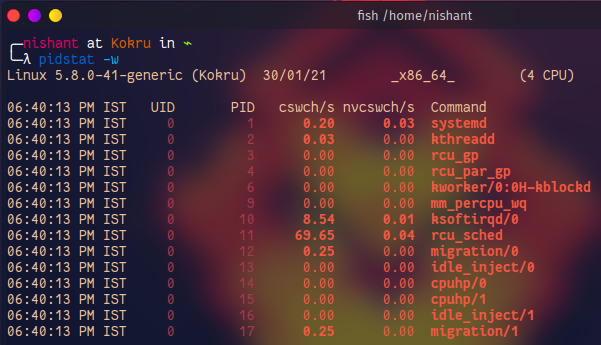
In this output there are two different terms we can see:
- cswch/s: Total number of voluntary context switches the task made per second.
- nvcswch/s: Total number of non-voluntary context switches the task made per second.
4) -t: This option is used to display statistics for threads associated with selected tasks. The output pidstat with this command is
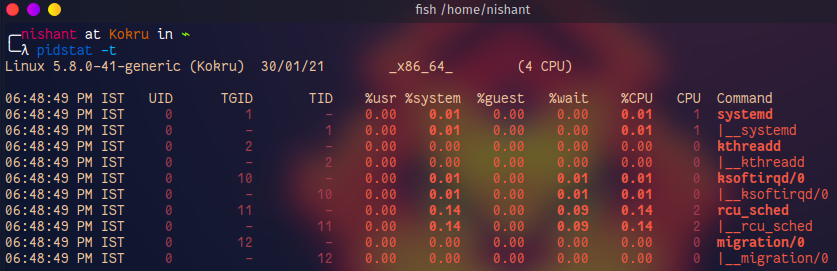
In this output, there are two different terms we can see:
- TGID: TGID is the identification number of the thread group leader.
- TID: The identification number of the thread being monitored.
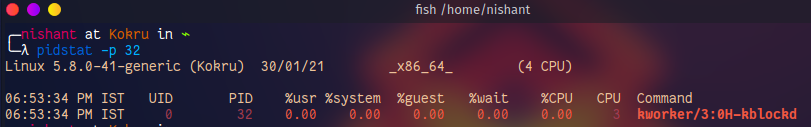
5) -p: With this argument, we can see information about the specific task by using its PID. Following is the command to use the -p option.
pidstat -p PID
Output:
Share your thoughts in the comments
Please Login to comment...