Matplotlib.pyplot.triplot() in python
Last Updated :
19 Apr, 2020
Matplotlib is a library in Python and it is numerical – mathematical extension for NumPy library. Pyplot is a state-based interface to a Matplotlib module which provides a MATLAB-like interface. There are various plots which can be used in Pyplot are Line Plot, Contour, Histogram, Scatter, 3D Plot, etc.
matplotlib.pyplot.triplot() Function:
The triplot() function in pyplot module of matplotlib library is used to draw a unstructured triangular grid as lines and/or markers.
Syntax: matplotlib.pyplot.triplot(*args, **kwargs)
Parameters: This method accept the following parameters that are described below:
Returns: This returns the list of 2 Line2D containing following:
- The lines plotted for triangles edges.
- The markers plotted for triangles nodes
Below examples illustrate the matplotlib.pyplot.triplot() function in matplotlib.pyplot:
Example 1:
import matplotlib.pyplot as plt
import matplotlib.tri as mtri
import numpy as np
x = np.asarray([0, 1, 2, 3, 0.5, 1.5,
2.5, 1, 2, 1.5])
y = np.asarray([0, 0, 0, 0, 1.0,
1.0, 1.0, 2, 2, 3.0])
triangles = [[0, 1, 4], [1, 2, 5],
[2, 3, 6], [1, 5, 4],
[2, 6, 5], [4, 5, 7],
[5, 6, 8], [5, 8, 7],
[7, 8, 9]]
triang = mtri.Triangulation(x, y, triangles)
z = np.cos(1.5 * x) * np.cos(1.5 * y)
plt.tricontourf(triang, z)
plt.triplot(triang, 'go-')
plt.title('matplotlib.pyplot.triplot() Example')
plt.show()
|
Output:

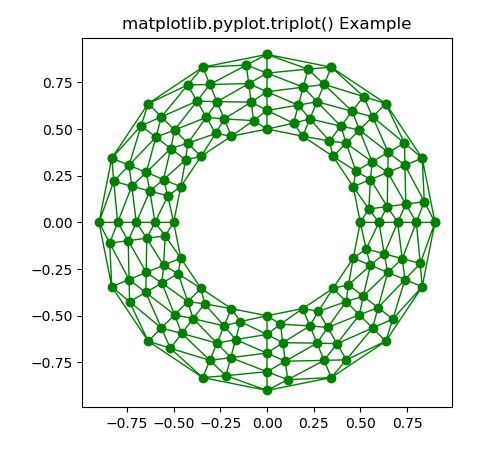
Example 2:
import matplotlib.pyplot as plt
import matplotlib.tri as tri
import numpy as np
n_angles = 24
n_radii = 9
min_radius = 0.5
radii = np.linspace(min_radius, 0.9,
n_radii)
angles = np.linspace(0, 3 * np.pi, n_angles,
endpoint = False)
angles = np.repeat(angles[..., np.newaxis],
n_radii, axis = 1)
angles[:, 1::2] += np.pi / n_angles
x = (radii * np.cos(angles)).flatten()
y = (radii * np.sin(angles)).flatten()
triang = tri.Triangulation(x, y)
triang.set_mask(np.hypot(x[triang.triangles].mean(axis = 1),
y[triang.triangles].mean(axis = 1))
< min_radius)
plt.triplot(triang, 'go-', lw = 1)
plt.title('matplotlib.pyplot.triplot() Example')
plt.show()
|
Output:
Share your thoughts in the comments
Please Login to comment...