Matplotlib.pyplot.set_cmap() in Python
Last Updated :
10 Jan, 2024
Matplotlib.pyplot.set_cmap() is a function in matplotlib that is used to set the default colormap for the current image or plot. A color map is a mapping from data values to colors, and it is essential in visualizing data through color variations, particularly in heatmaps, contour plots, and other types of color-mapped visualizations.
Matplotlib.pyplot.set_cmap() Syntax
Syntax: matplotlib.pyplot.set_cmap(cmap)
Parameters:
- cmap : This parameter is the colormap instance or the name of a registered colormap.
Returns: This method does not return any value.
Python Matplotlib.pyplot.set_cmap() Examples
Below are some examples by which we can learn more about Matplotlib.set_cmap() function and how to use Matplotlib cmap in Python:
- Matplotlib Triangular Plot
- Matplotlib Plot with Color Mapping
- 3-D Surface Plot with Colormap
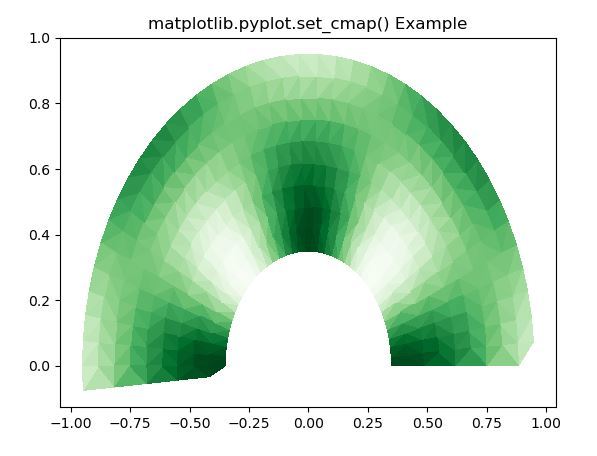
Matplotlib Triangular Plot Using matplotlib.set_cmap() Functions
In this example below code implements a triangular plot using Matplotlib, where radial and angular coordinates are used to define points. The radial values vary from 0.35 to 0.95, forming concentric circles, while the angular values cover a range from 0 to π, divided into 40 segments. These coordinates are then transformed into Cartesian coordinates (x, y) and an additional variable (z) is computed based on a sinusoidal function.
Python3
import matplotlib.pyplot as plt
import matplotlib.tri as tri
import numpy as np
ang = 40
rad = 10
radm = 0.35
radii = np.linspace(radm, 0.95, rad)
angles = np.linspace(0, np.pi, ang)
angles = np.repeat(angles[..., np.newaxis],
rad, axis = 1)
angles[:, 1::2] += np.pi / ang
x = (radii * np.cos(angles)).flatten()
y = (radii * np.sin(angles)).flatten()
z = (np.sin(4 * radii) * np.cos(4 * angles)).flatten()
triang = tri.Triangulation(x, y)
triang.set_mask(np.hypot(x[triang.triangles].mean(axis = 1),
y[triang.triangles].mean(axis = 1))
< radm)
tpc = plt.tripcolor(triang, z,
shading ='flat')
plt.set_cmap("Greens")
plt.title('matplotlib.pyplot.set_cmap() Example')
plt.show()
|
Output:
Matplotlib Plot with Color Mapping using Matplotlib.set_cmap() Function
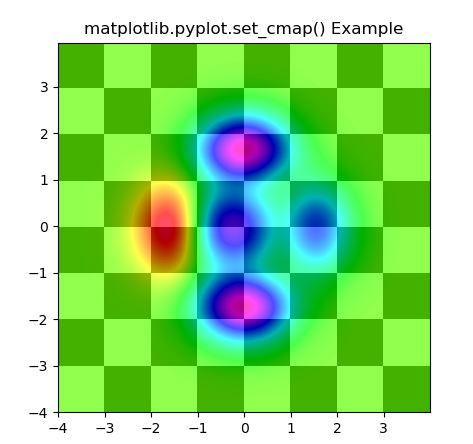
In this example, we are using Matplotlib to create a plot with two overlaid images. The first image (Z1) generates a checkerboard pattern using modulo operations, displayed in binary reversed colormap. The second image (Z2) is created by applying a mathematical function on a meshgrid (X, Y). The resulting plot combines both images with different alpha values, creating a visually interesting composition.
Python3
import matplotlib.pyplot as plt
import numpy as np
from matplotlib.colors import LogNorm
dx, dy = 0.015, 0.05
x = np.arange(-4.0, 4.0, dx)
y = np.arange(-4.0, 4.0, dy)
X, Y = np.meshgrid(x, y)
extent = np.min(x), np.max(x), np.min(y), np.max(y)
Z1 = np.add.outer(range(8), range(8)) % 2
plt.imshow(Z1, cmap ="binary_r",
interpolation ='nearest',
extent = extent, alpha = 1)
def geeks(x, y):
return (1 - x / 2 + x**5 + y**6) * np.exp(-(x**2 + y**2))
Z2 = geeks(X, Y)
plt.imshow(Z2, alpha = 0.7,
interpolation ='bilinear',
extent = extent)
plt.set_cmap("gist_rainbow")
plt.title('matplotlib.pyplot.set_cmap() Example')
plt.show()
|
Output:
Surface Plot with Colormap Using matplotlib.set_cmap() Method
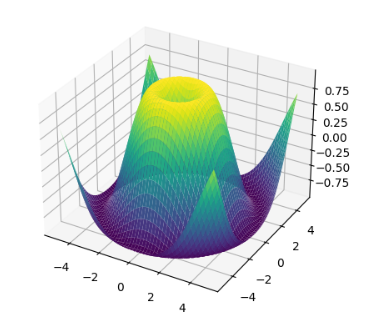
In this example, we are using NumPy and Matplotlib to create a 3D surface plot of a mathematical function. It generates a grid of x and y values, computes the corresponding z values based on the function (sin(sqrt(x^2 + y^2))), and visualizes the surface plot using the ‘viridis’ colormap. The code then adds the ‘coolwarm’ colormap using plt.set_cmap(), although this line seems unnecessary as it doesn’t affect the created surface plot.
Python3
import numpy as np
import matplotlib.pyplot as plt
from mpl_toolkits.mplot3d import Axes3D
x = np.linspace(-5, 5, 100)
y = np.linspace(-5, 5, 100)
X, Y = np.meshgrid(x, y)
Z = np.sin(np.sqrt(X**2 + Y**2))
fig = plt.figure()
ax = fig.add_subplot(111, projection='3d')
surf = ax.plot_surface(X, Y, Z, cmap='viridis')
plt.set_cmap('coolwarm')
plt.show()
|
Output:
Share your thoughts in the comments
Please Login to comment...