matplotlib.pyplot.clabel() in Python
Last Updated :
29 Aug, 2020
Contour plots or Level plots are a way to display a three-dimensional surface on a two-dimensional plane. It graphs as contours as one output variable z and two predictor variables x and y on the y-axis. Often such contours are also known as z-slices.
The clabel() method in mathplotlib.pyplot is used add labels to line contours in instances of the classes to support contour plotting.
Syntax: matplotlib.pyplot.clabel(CS, levels=None, **kwargs)
Parameters:
- CS: The ContourSet to label.
- levels: A list of level values, that should be labeled. The list must be a subset of CS.levels. If not given,all levels are labeled. It is an optional argument(default value is None).
- fontsize: Size in points or relative size e.g., ‘smaller’, ‘x-large’. See Text.set_size for accepted string values.
- colors: The label colors-
- If None, the color of each label matches the color of the corresponding contour.
- If one string color, e.g., colors = ‘r’ or colors = ‘red’, all labels will be plotted in this color.
- If a tuple of matplotlib color args (string, float, rgb, etc), different labels will be plotted in different colors in the order specified.
Below are some programs to illustrate the use of matplotlib.pyplot.clabel() :
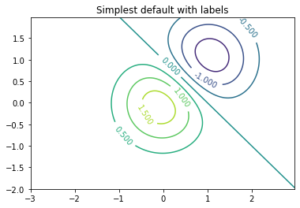
Example 1: Create a simple contour plot with labels using default colors. The inline argument to clabel will control whether the labels are draw over the line segments of the contour, removing the lines beneath the label.
Python3
import numpy
import matplotlib.pyplot
delta = 0.025
x = numpy.arange(-3.0, 3.0, delta)
y = numpy.arange(-2.0, 2.0, delta)
X, Y = numpy.meshgrid(x, y)
Z1 = numpy.exp(-X**2 - Y**2)
Z2 = numpy.exp(-(X - 1)**2 - (Y - 1)**2)
Z = (Z1 - Z2) * 2
fig, ax = matplotlib.pyplot.subplots()
CS = ax.contour(X, Y, Z)
ax.clabel(CS, inline=1, fontsize=10)
ax.set_title('Simplest default with labels')
|
Output:
Example 2: Contour labels can be placed manually by providing a list of positions (in data coordinate). See ginput_manual_clabel.py for interactive placement.
Python3
import numpy
import matplotlib.pyplot
delta = 0.025
x = numpy.arange(-3.0, 3.0, delta)
y = numpy.arange(-2.0, 2.0, delta)
X, Y = numpy.meshgrid(x, y)
Z1 = numpy.exp(-X**2 - Y**2)
Z2 = numpy.exp(-(X - 1)**2 - (Y - 1)**2)
Z = (Z1 - Z2) * 2
fig, ax = matplotlib.pyplot.subplots()
CS = ax.contour(X, Y, Z)
manual_locations = [(-1, -1.4), (-0.62, -0.7),
(-2, 0.5), (1.7, 1.2),
(2.0, 1.4), (2.4, 1.7)]
ax.clabel(CS, inline=1, fontsize=10, manual=manual_locations)
ax.set_title('labels at selected locations')
|
Output:

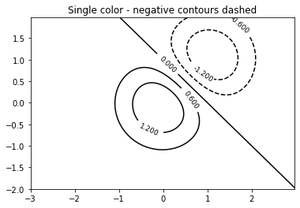
Example 3: You can force all the contours to be the same color.
Python3
import numpy
import matplotlib.pyplot
delta = 0.025
x = numpy.arange(-3.0, 3.0, delta)
y = numpy.arange(-2.0, 2.0, delta)
X, Y = numpy.meshgrid(x, y)
Z1 = numpy.exp(-X**2 - Y**2)
Z2 = numpy.exp(-(X - 1)**2 - (Y - 1)**2)
Z = (Z1 - Z2) * 2
fig, ax = matplotlib.pyplot.subplots()
CS = ax.contour(X, Y, Z, 6,
colors='k',
)
ax.clabel(CS, fontsize=9, inline=1)
ax.set_title('Single color - negative contours dashed')
|
Output:
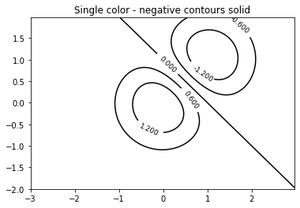
Example 4: You can set negative contours to be solid instead of dashed:
Python3
import numpy
import matplotlib.pyplot
delta = 0.025
x = numpy.arange(-3.0, 3.0, delta)
y = numpy.arange(-2.0, 2.0, delta)
X, Y = numpy.meshgrid(x, y)
Z1 = numpy.exp(-X**2 - Y**2)
Z2 = numpy.exp(-(X - 1)**2 - (Y - 1)**2)
Z = (Z1 - Z2) * 2
matplotlib.rcParams['contour.negative_linestyle'] = 'solid'
fig, ax = matplotlib.pyplot.subplots()
CS = ax.contour(X, Y, Z, 6,
colors='k',
)
ax.clabel(CS, fontsize=9, inline=1)
ax.set_title('Single color - negative contours solid')
|
Output:
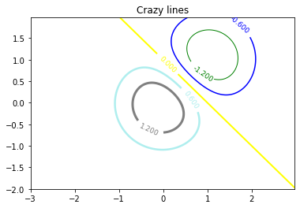
Example 5: You can manually specify the colors of the contour.
Python3
import numpy
import matplotlib.pyplot
delta = 0.025
x = numpy.arange(-3.0, 3.0, delta)
y = numpy.arange(-2.0, 2.0, delta)
X, Y = numpy.meshgrid(x, y)
Z1 = numpy.exp(-X**2 - Y**2)
Z2 = numpy.exp(-(X - 1)**2 - (Y - 1)**2)
Z = (Z1 - Z2) * 2
fig, ax = matplotlib.pyplot.subplots()
CS = ax.contour(X, Y, Z, 6,
linewidths=np.arange(.5, 4, .5),
colors=('r', 'green', 'blue',
(1, 1, 0), '#afeeee', '0.5')
)
ax.clabel(CS, fontsize=9, inline=1)
ax.set_title('Crazy lines')
|
Output:
Share your thoughts in the comments
Please Login to comment...