Matplotlib.figure.Figure.get_dpi() in Python
Last Updated :
30 Apr, 2020
Matplotlib is a library in Python and it is numerical – mathematical extension for NumPy library. The figure module provides the top-level Artist, the Figure, which contains all the plot elements. This module is used to control the default spacing of the subplots and top level container for all plot elements.
matplotlib.figure.Figure.get_dpi() method
The get_dpi() method of figure module of matplotlib library is used to get the resolution in dots per inch as a float.
Syntax: get_dpi(self)
Parameters: This method does not accept any parameters.
Returns: This method return the resolution in dots per inch as a float.
Below examples illustrate the matplotlib.figure.Figure.get_dpi() function in matplotlib.figure:
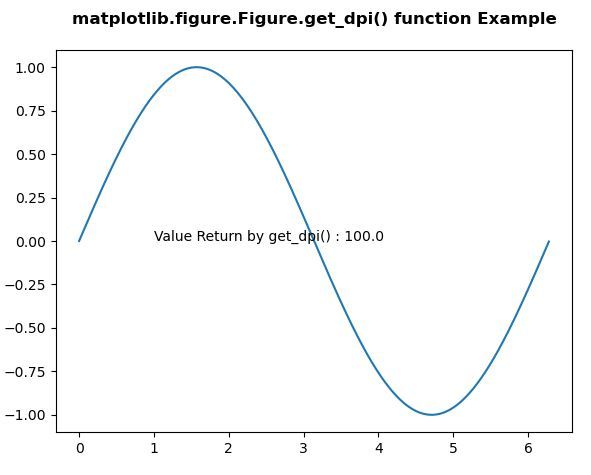
Example 1:
import matplotlib.pyplot as plt
from matplotlib.figure import Figure
import numpy as np
fig = plt.figure(figsize =(5, 4))
ax = fig.add_axes([0.1, 0.1, 0.8, 0.8])
xx = np.arange(0, 2 * np.pi, 0.01)
ax.plot(xx, np.sin(xx))
w = fig.get_dpi()
ax.text(1, 0, "Value Return by get_dpi() : "
+str(w))
fig.canvas.draw()
fig.suptitle('matplotlib.figure.Figure.get_dpi() function \
Example', fontweight ="bold")
plt.show()
|
Output:
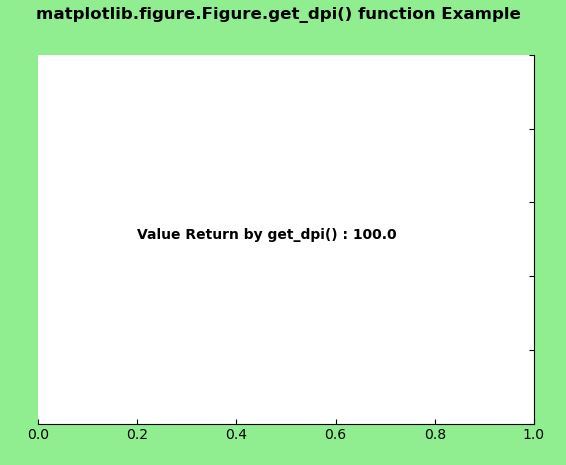
Example 2:
import matplotlib.pyplot as plt
from matplotlib.figure import Figure
from mpl_toolkits.axisartist.axislines import Subplot
import numpy as np
fig = plt.figure(facecolor ="lightgreen")
ax = Subplot(fig, 111)
fig.add_subplot(ax)
ax.axis["left"].set_visible(False)
ax.axis["top"].set_visible(False)
w = fig.get_dpi()
ax.text(0.2, 0.5, "Value Return by get_dpi() : "
+str(w),
fontweight ="bold")
fig.canvas.draw()
fig.suptitle('matplotlib.figure.Figure.get_dpi()\
function Example', fontweight ="bold")
plt.show()
|
Output:
Share your thoughts in the comments
Please Login to comment...