Matplotlib.figure.Figure.delaxes() in Python
Last Updated :
30 Apr, 2020
Matplotlib is a library in Python and it is numerical – mathematical extension for NumPy library. The figure module provides the top-level Artist, the Figure, which contains all the plot elements. This module is used to control the default spacing of the subplots and top level container for all plot elements.
matplotlib.figure.Figure.delaxes() function
The delaxes() method of figure module of matplotlib library is used to remove the Axes ax from the figure and update the current axes.
Syntax: delaxes(self, ax)
Parameters: This accept the following parameters that are described below:
- ax: This parameter is the axes to be removed.
Returns: This method does not return any value.
Below examples illustrate the matplotlib.figure.Figure.delaxes() function in matplotlib.figure:
Example 1:
import matplotlib.pyplot as plt
import numpy as np
fig, ax = plt.subplots()
ax.plot([1, 2, 3])
fig.delaxes(ax)
fig.suptitle('matplotlib.figure.Figure.delaxes() \
function Example\n\n', fontweight ="bold")
plt.show()
|
Output:
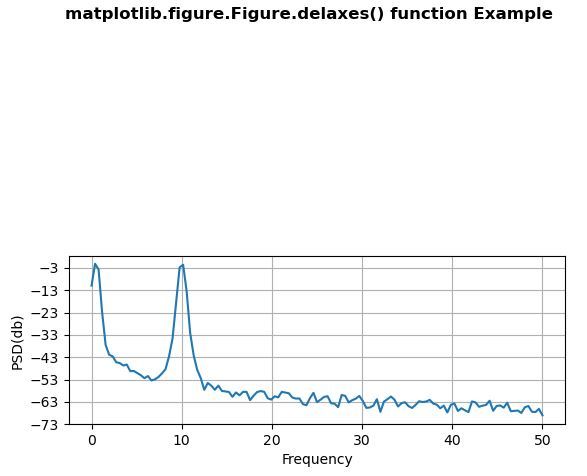
Example 2:
import numpy as np
import matplotlib.pyplot as plt
dt = 0.01
t = np.arange(0, 30, dt)
nse1 = np.random.randn(len(t))
r = np.exp(-t / 0.05)
cnse1 = np.convolve(nse1, r, mode ='same')*dt
s1 = np.cos(np.pi * t) + cnse1 + np.sin(2 * np.pi * 10 * t)
fig, [ax1, ax2] = plt.subplots(2, 1)
ax1.plot(t, s1)
ax1.set_xlim(0, 5)
ax1.set_ylabel('value s1')
ax1.grid(True)
ax2.psd(s1, 256, 1./dt)
ax2.set_ylabel('PSD(db)')
ax2.set_xlabel('Frequency')
fig.delaxes(ax = ax1)
fig.suptitle('matplotlib.figure.Figure.delaxes() \
function Example\n\n', fontweight ="bold")
plt.show()
|
Output:
Share your thoughts in the comments
Please Login to comment...