Make filled polygons between two horizontal curves in Python using Matplotlib
Last Updated :
10 Jul, 2020
Matplotlib is an amazing visualization library in Python for 2D plots of arrays. Matplotlib is a multi-platform data visualization library built on NumPy arrays and designed to work with the broader SciPy stack.
To create filled polygons between two curves a PolyCollection filling needs to be created between y1 and y2.
Parameters for the above task:
- x: It is an array of length N that holds data of x.
- y1: It is an array or a scalar of length N that holds data of y.
- y2: It is an array or a scalar of length N that holds data of y.
Below is the implementation.
import matplotlib.pyplot as plt
x_inp= input("Enter values of X array: ").split()
x= [int(i) for i in x_inp]
y1_inp= input("Enter values of Y1 array: ").split()
y1= [int(i) for i in y1_inp]
y2_inp= input("Enter values of Y2 array: ").split()
y2= [int(i) for i in y2_inp]
color=input("Enter color: ")
plt.fill_between(x, y1, y2, color = color)
plt.show()
|
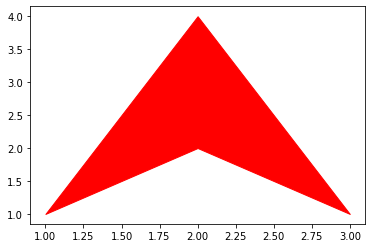
For input:
Enter values of X array:  1 2 3
Enter values of Y1 array:  1 2 1
Enter values of Y2 array:  1 4 1
Enter color:  red
Output :
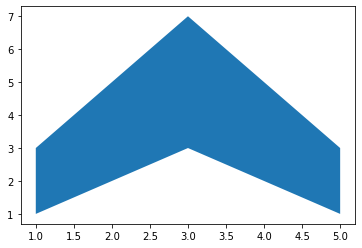
For input:
Enter values of X array:  1 2 3 4 5
Enter values of Y1 array:  1 2 3 2 1
Enter values of Y2 array:  3 5 7 5 3
Enter color:  blue
Output :
Share your thoughts in the comments
Please Login to comment...