How to plot a complex number in Python using Matplotlib ?
Last Updated :
03 Jan, 2021
In this article we will learn how to plot complex number in Python using Matplotlib. Let’s discuss some concepts :
- Matplotlib : Matplotlib is an amazing visualization library in Python for 2D plots of arrays. Matplotlib is a multi-platform data visualization library built on NumPy arrays and designed to work with the broader SciPy stack. It was introduced by John Hunter in the year 2002.
- Complex number : A complex number is a number that can be expressed in the form a + bi, where a and b are real numbers, and i represents the imaginary unit, satisfying the equation i2 = −1. Because no real number satisfies this equation, i is called an imaginary number.
- Complex number in Python : An complex number is represented by “ x + yi “. Python converts the real numbers x and y into complex using the function complex(x,y). The real part can be accessed using the function real() and imaginary part can be represented by imag().
Approach:
- Import libraries.
- Create data of complex numbers
- Extract real and imaginary parts from complex numbers data
- Plot the extracted data.
Examples:
To plot complex numbers, we have to extract its real and imaginary part and to extract and create data, we will use some methods that are explained in below examples :
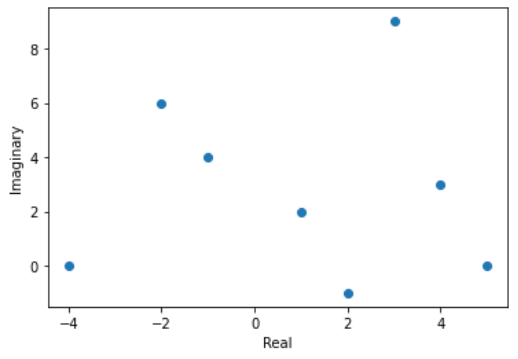
Example 1 : (Simple plot with complex numbers over real and imaginary data)
Python3
import matplotlib.pyplot as plt
data = [1+2j, -1+4j, 4+3j, -4, 2-1j, 3+9j, -2+6j, 5]
x = [ele.real for ele in data]
y = [ele.imag for ele in data]
plt.scatter(x, y)
plt.ylabel('Imaginary')
plt.xlabel('Real')
plt.show()
|
Output :
Example 2 : (Using numpy for extracting real and imaginary parts)
Python3
import matplotlib.pyplot as plt
import numpy as np
data = np.array([1+2j, 2-4j, -2j, -4, 4+1j, 3+8j, -2-6j, 5])
x = data.real
y = data.imag
plt.plot(x, y, 'g*')
plt.ylabel('Imaginary')
plt.xlabel('Real')
plt.show()
|
Output :

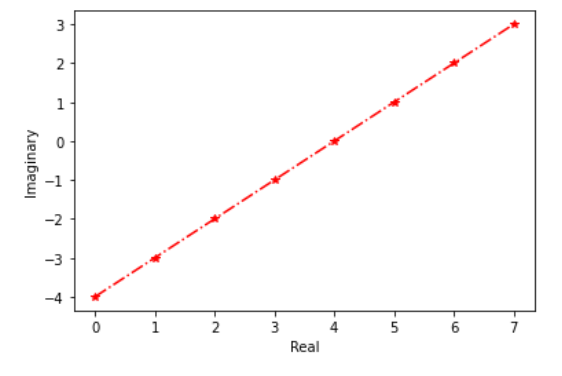
Example 3 : (Using numpy for creating data of complex numbers and extracting real and imaginary parts)
Python3
import matplotlib.pyplot as plt
import numpy as np
data = np.arange(8) + 1j*np.arange(-4, 4)
x = data.real
y = data.imag
plt.plot(x, y, '-.r*')
plt.ylabel('Imaginary')
plt.xlabel('Real')
plt.show()
|
Output :
Share your thoughts in the comments
Please Login to comment...