How to Format X Axis Time Scale Values in ChartJS ?
Last Updated :
14 Mar, 2024
In Chart.js, formatting the x-axis time values involves searching for ways to present temporal data effectively. By default, Chart.js supports time series data and provides powerful options to customize the appearance of time labels on the x-axis.
There are several approaches to format x-axis time scale values in Chart.js which are as follows:
CDN Link:
<script src="https://cdn.jsdelivr.net/npm/chart.js"></script>
<script src="https://cdnjs.cloudflare.com/ajax/libs/Chart.js/2.1.0/Chart.bundle.min.js"></script>
Using the time type for the x-axis scale configuration
In this approach, we are utilizing the `type: `time` ` option in chart.js to define the x-axis scale as time-oriented. By setting the type to “time,” the chart automatically adjusts to handle temporal data, allowing for intuitive visualization and analysis of time-series data.
Syntax:
// Approach 1:
scales: {
    xAxes: [{
        type: 'time'
    }]
}
Example: Time Series Line Chart
HTML
<!DOCTYPE html>
<html lang="en">

<head>
    <meta charset="UTF-8">
    <meta name="viewport" content="width=device-width, initial-scale=1.0">
    <title>Chart.js Time Scale Approach 3</title>
    <script src=
"https://cdnjs.cloudflare.com/ajax/libs/moment.js/2.13.0/moment.min.js">
      </script>
    <script src=
"https://cdnjs.cloudflare.com/ajax/libs/Chart.js/2.1.0/Chart.bundle.min.js">
      </script>
</head>

<body>
    <canvas id="myChart"></canvas>

    <script>
        window.onload = function () {
            let ctx = document.getElementById("myChart").getContext("2d");

            // Sample data
            let data = {
                labels: ["2023-03-01", "2023-03-02", "2023-03-03", "2023-03-04", "2023-03-05"],
                datasets: [{
                    label: "My First dataset",
                    data: [12, 19, 3, 5, 2],
                }]
            };

            let chart = new Chart(ctx, {
                type: 'line',
                data: data,
                options: {
                    scales: {
                        xAxes: [{
                            type: 'time',
                            time: {
                                displayFormats: {
                                    day: 'MMM DD, YYYY'
                                    // or any desired format
                                }
                            }
                        }]
                    }
                }
            });
        }
    </script>
</body>

</html>
Output:
 Setting the “unit” option for the time scale
We focus on configuring the granularity of time intervals displayed on the x-axis by setting the unit option for the time scale in Chart.js.In this approach, emphasis is placed on configuring the time scale of a Chart.js chart to display data aggregated by a specific time unit, such as month. By setting the unit option, the chart effectively organizes temporal data into meaningful intervals, providing clarity and insight into trends over time.
Syntax:
scales: {
    xAxes: [{
        type: 'time',
        time: {
            unit: 'day' // or 'month', 'year', etc.
        }
    }]
}
Example: Monthly Time Series Line Chart
HTML
<!DOCTYPE html>
<html lang="en">

<head>
    <meta charset="UTF-8">
    <meta name="viewport" content="width=device-width, initial-scale=1.0">
    <title>Chart.js Time Scale Approach 2</title>
    <script src=
"https://cdnjs.cloudflare.com/ajax/libs/Chart.js/2.1.0/Chart.bundle.min.js">
      </script>
</head>
<style>
    * {
        background-color: bisque;
    }
</style>

<body>
    <h1 style="color: aqua;">
          Time Scale Approach 1| GeeksForGeeks
      </h1>
    <canvas id="myChart"></canvas>

    <script>
        window.onload = function () {
            let ctx =
                document.getElementById("myChart").getContext("2d");

            // Sample data
            let data = {
                labels: ["2023-03-01", "2023-03-02", "2023-03-03", "2023-03-04", "2023-03-05"],
                datasets: [{
                    label: "My First dataset",
                    data: [12, 19, 3, 5, 2],
                }]
            };

            let chart = new Chart(ctx, {
                type: 'line',
                data: data,
                options: {
                    scales: {
                        xAxes: [{
                            type: 'time',
                            time: {
                                unit: 'day' // or 'month', 'year', etc.
                            }
                        }]
                    }
                }
            });
        }
    </script>
</body>

</html>
Output:
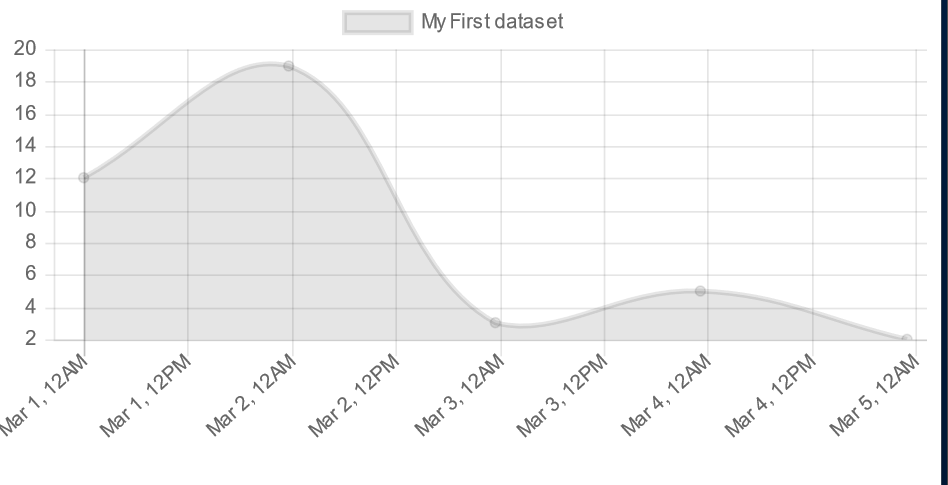
This approach delves into the customization of time label display formats on the x-axis of a Chart.js chart. This HTML code sets up a basic webpage with a canvas element for displaying the Chart.js chart. The JavaScript code inside the <script> tags initializes Chart.js, creates a line chart, and configures the x-axis time scale to format labels as ‘MMM DD, YYYY’.
Syntax:
scales: {
    xAxes: [{
        type: 'time',
        time: {
            displayFormats: {
                day: 'MMM DD' // or any desired format
            }
        }
    }]
}
Example: Custom Time Format for Time Series Line Chart
HTML
<!DOCTYPE html>
<html lang="en">

<head>
    <meta charset="UTF-8">
    <meta name="viewport" content="width=device-width, initial-scale=1.0">
    <title>Chart.js Time Scale Approach 3</title>
    <script src=
"https://cdnjs.cloudflare.com/ajax/libs/moment.js/2.13.0/moment.min.js">
      </script>
    <script src=
"https://cdnjs.cloudflare.com/ajax/libs/Chart.js/2.1.0/Chart.bundle.min.js">
      </script>
</head>

<body>
    <canvas id="myChart"></canvas>

    <script>
        window.onload = function () {
            let ctx = document.getElementById("myChart").getContext("2d");

            // Sample data
            let data = {
                labels: ["2023-03-01", "2023-03-02", "2023-03-03", "2023-03-04", "2023-03-05"],
                datasets: [{
                    label: "My First dataset",
                    data: [12, 19, 3, 5, 2],
                }]
            };

            let chart = new Chart(ctx, {
                type: 'line',
                data: data,
                options: {
                    scales: {
                        xAxes: [{
                            type: 'time',
                            time: {
                                displayFormats: {
                                    day: 'MMM DD, YYYY' // or any desired format
                                }
                            }
                        }]
                    }
                }
            });
        }
    </script>
</body>

</html>
Output:
Share your thoughts in the comments
Please Login to comment...