How to Create a Correlation Matrix using Pandas?
Last Updated :
08 Oct, 2021
Correlation is a statistical technique that shows how two variables are related. Pandas dataframe.corr() method is used for creating the correlation matrix. It is used to find the pairwise correlation of all columns in the dataframe. Any na values are automatically excluded. For any non-numeric data type columns in the dataframe it is ignored.
To create correlation matrix using pandas, these steps should be taken:
- Obtain the data.
- Create the DataFrame using Pandas.
- Create correlation matrix using Pandas
Example 1:
Python3
import pandas as pd
data = {'A': [45, 37, 42],
'B': [38, 31, 26],
'C': [10, 15, 17]
}
df = pd.DataFrame(data)
corrM = df.corr()
corrM
|
Output:
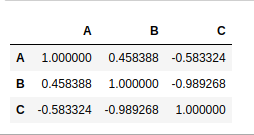
Values at the diagonal shows the correlation of a variable with itself, hence diagonal shows the correlation 1.
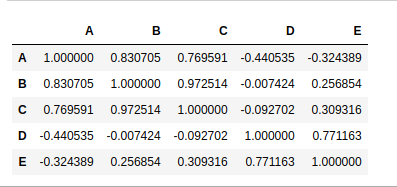
Example 2:
Python3
import pandas as pd
data = {'A': [45, 37, 42, 50],
'B': [38, 31, 26, 90],
'C': [10, 15, 17, 100],
'D': [60, 99, 23, 56],
'E': [76, 98, 78, 90]
}
df = pd.DataFrame(data)
corrM = df.corr()
corrM
|
Output:
Example 3:
Python3
import pandas as pd
data = {'A': [45, 37, 42, 50],
'B': ['R', 'O', 'M', 'Y'],
}
df = pd.DataFrame(data)
corrM = df.corr()
corrM
|
Output:

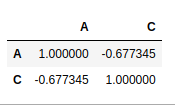
Example 4:
Python3
import pandas as pd
data = {'A': [45, 37, 42, 50],
'B': ['R', 'O', 'M', 'Y'],
'C': [56, 67, 68, 60],
}
df = pd.DataFrame(data)
corrM = df.corr()
corrM
|
Output:
Like Article
Suggest improvement
Share your thoughts in the comments
Please Login to comment...