How to change the position of legend in Pygal?
Last Updated :
24 Jan, 2021
Prerequisites: pygal
Pygal is a Python module that is mainly used to build SVG (Scalar Vector Graphics) graphs and charts. Pygal is a graphics and user interface library for Python that provides functionality commonly required in designing and science applications.
In this article, we will see how we can change the legend position and number of legend columns in the plot window. While making a plot it is important for us to optimize its size and legend position. Here are various ways to change the default legend position as per our requirement.
Approach:
- Import required module.
- Create a chart object.
- Pass legend position in the same function.
- Label the graph.
- Display Graph.
Implementation of the concept discussed above is given below:
Example 1:
Python3
import pygal
import numpy
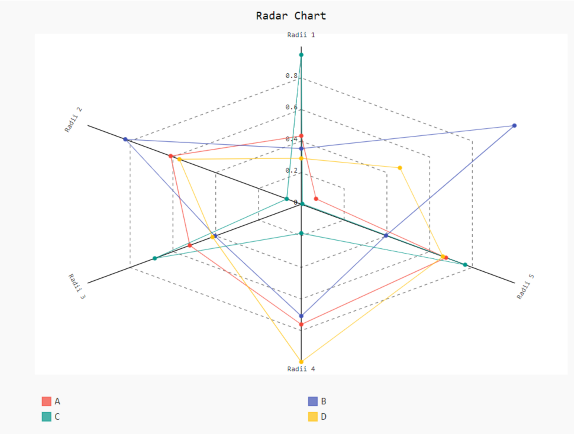
Radar_Chart = pygal.Radar(legend_at_bottom=True)
Radar_Chart.x_labels = ['Radii 1', 'Radii 2',
'Radii 3', 'Radii 4',
'Radii 5']
Radar_Chart.add('A', numpy.random.rand(6))
Radar_Chart.add('B', numpy.random.rand(6))
Radar_Chart.add('C', numpy.random.rand(6))
Radar_Chart.add('D', numpy.random.rand(6))
Radar_Chart.title = 'Radar Chart'
Radar_Chart.render_to_png('aa.png')
|
Output
Example 2:
Python3
import pygal
import numpy
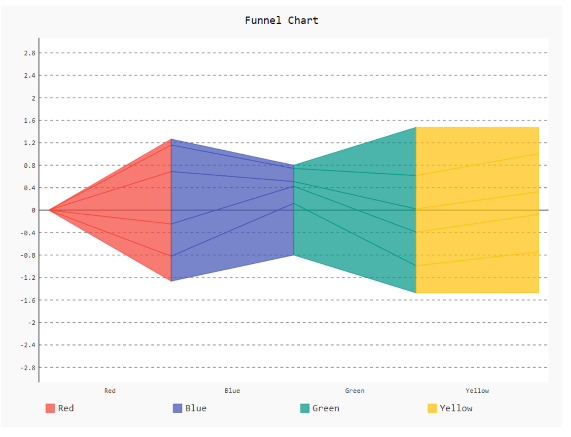
funnel = pygal.Funnel(legend_at_bottom=True, legend_at_bottom_columns=4)
funnel.add('Red', numpy.random.rand(5))
funnel.add('Blue', numpy.random.rand(5))
funnel.add('Green', numpy.random.rand(5))
funnel.add('Yellow', numpy.random.rand(5))
funnel.title = 'Funnel Chart'
funnel.render_to_png('aa.png')
|
Output
Share your thoughts in the comments
Please Login to comment...