How to change size of labels in the Bokeh legend?
Last Updated :
12 Jul, 2021
In this article, we will be learning about how to change the size of labels in bokeh legend. Legend plays a very important role in bokeh. With the help of legend, we can point to various types of glyphs in a plot that bokeh provides us, and can customize them according to our choice. Along with that, we can also change various properties of the glyphs text shown in a box in a plot. Apart from that, there are various attributes that we can use to customize a legend.
Some of the attributes that can be used to customize a glyph: legend.label_text_font, legend.label_text_font_size, legend.location, legend.title, legend.orientation and, legend.clicking_policy.
Now, before proceeding further, we must be sure to have bokeh installed on our local device. If not, then open a command prompt and type the following command:
pip install bokeh
Now we are ready to go. It is necessary to install bokeh, else the functionalities won’t work. So, let us move to the implementation of the above concept.
Example 1:
In the following example, we will be changing the font size of the labels using bokeh legend and along with that, we will be learning some other features too.
Python3
import numpy as np
from bokeh.plotting import figure, show
x = np.linspace(0, 20, 100)
y = x*2
p1 = figure(plot_width=600, plot_height=600)
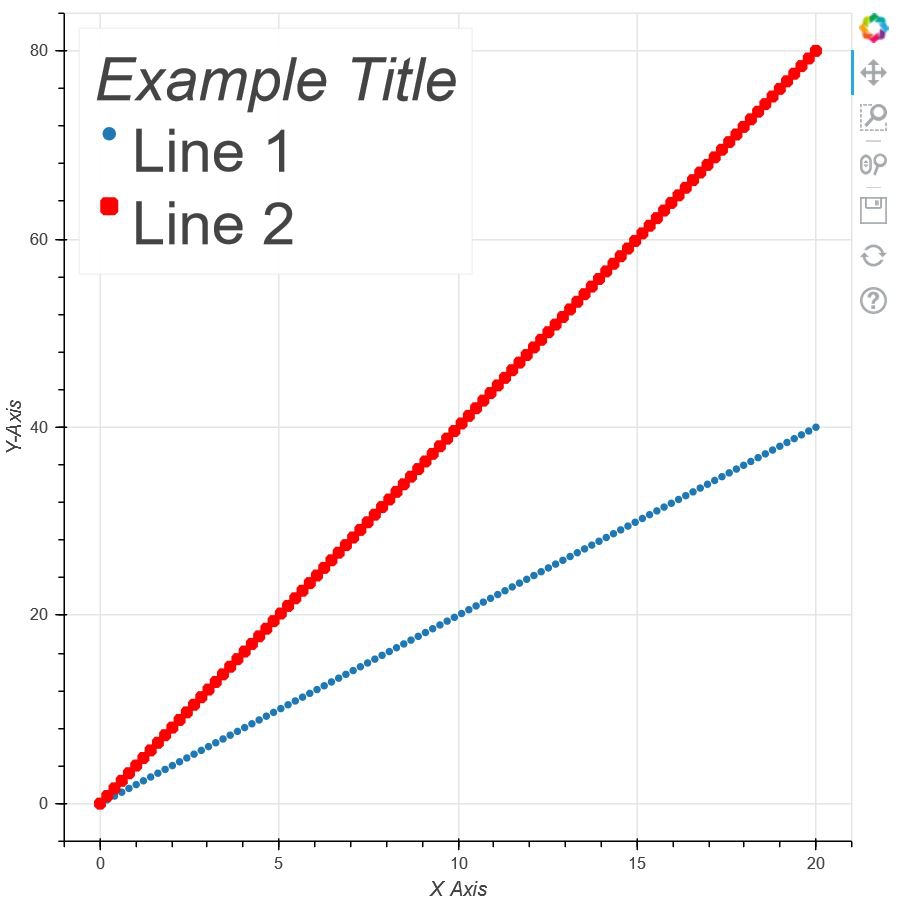
p1.circle(x, y, legend_label="Line 1")
p1.square(x, 2*y, legend_label="Line 2",
color="red", line_width=4)
p1.legend.title = 'Example Title'
p1.xaxis.axis_label = "X Axis"
p1.yaxis.axis_label = "Y-Axis"
p1.legend.location = "top_left"
p1.legend.title_text_font_size = '30pt'
p1.legend.label_text_font_size = "30pt"
show(p1)
|
Output:
Explanation:
In the above code, after initializing all the necessary packages from the libraries and modules, we are creating two points x and y which are a list of arbitrary values. Now we will be plotting those values in our graph. So, for that, we are creating an empty figure/plot whose plot width and height are given as 600. After that, we are plotting the two graphs where points on the first graph are in the shape of a circle and the points on the second graph are in the shape of a square. Apart from the different colors of the two graphs, in order to differentiate between them, we are creating a box where we are providing the labels for both the glyphs using legend_label and we are also giving a title to that box. Now comes the main implementation i.e changing the size of the labels using bokeh legend. So, by using legend.label_text_font_size we are customizing the size of the labels and glyphs in the box, and since we have given a title to the box, legend.label_text_font_size helps us to change the size of the title. Along with changing the size, we are also changing its orientation i.e on the top-left corner using legend.location.
Example 2:
Now, in the second example, lets us explore some more attributes of how to change sizes using legend. In the example below, instead of using label_text_font_size, we can also use glyph_height, glyph_width, label_height, label_width which are responsible for changing the labels and the glyph sizes separately in the label box differentiating all the lines. Let us move to the main implementation now.
Python3
import numpy as np
from bokeh.plotting import figure, show
x = np.arange(11)
y = x**2
z = [1, 6, 1, 4, 8, 6, 2, 6, 4, 9, 10]
p = figure(plot_height=600, plot_width=600)
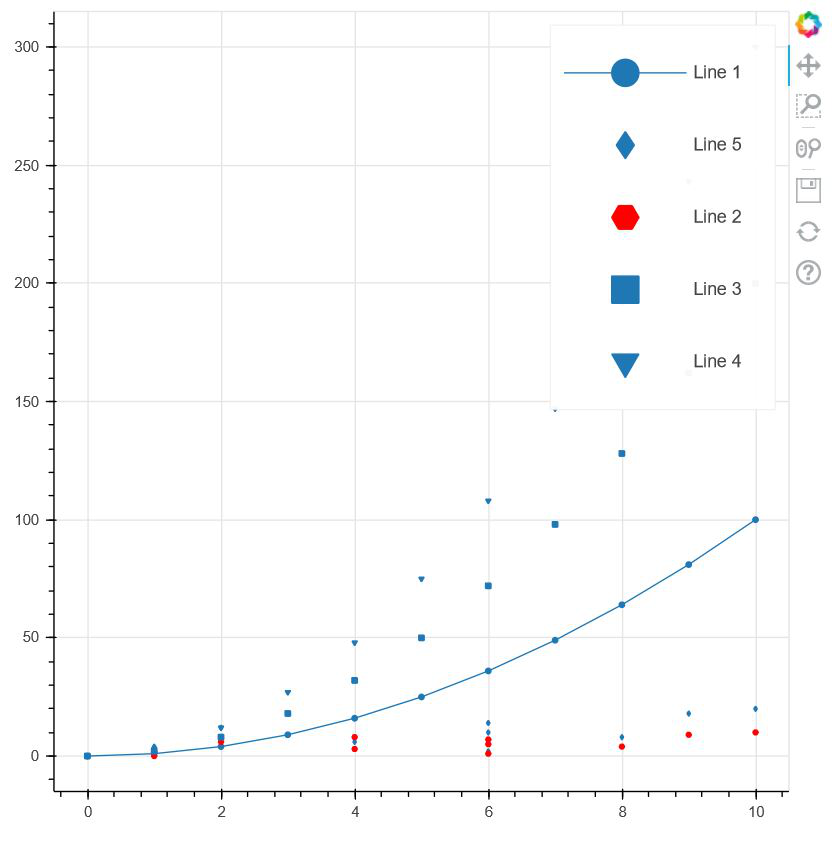
p.circle(x, y, legend_label="Line 1")
p.line(x, y, legend_label="Line 1")
p.diamond(z, x*2, legend_label="Line 5")
p.hex(z, x, legend_label="Line 2", color="red")
p.square(x, y*2, legend_label="Line 3")
p.inverted_triangle(x, y*3, legend_label="Line 4")
p.legend.glyph_height = 50
p.legend.glyph_width = 90
p.legend.label_height = 50
p.legend.label_width = 50
show(p)
|
Output:
Explanation:
In the above code, we have imported numpy package along with the figure and show for plot creation and showing. After importing the packages, we are creating three different lists of numbers which are then plotted against each other in graphical format. They are of different shapes. Using legend in bokeh, we are labeling them differently, and using the following attributes mentioned above, we are changing the size of the glyphs and the labels separately which also affects the box size.
Like Article
Suggest improvement
Share your thoughts in the comments
Please Login to comment...