How to Calculate Percent Change in Excel
Last Updated :
16 Apr, 2024
Calculating per cent change in Excel is a useful skill for analyzing data trends, tracking growth, and making informed decisions. Whether you’re working with financial data, sales figures, or any other type of numerical data, understanding how to calculate per cent change allows you to compare values over time easily.
What is Percent Change in Excel?
Percentage change in Excel lets you figure out how much a value has gone up or down compared to another value. It’s like a percentage report card for your data. For example,
- You have two numbers, like your sales this month and last month.
- Excel helps you calculate the difference between those numbers.
- Then it divides that difference by the original number (usually the older one).
- Finally, it shows you this difference as a percentage.
So, if your sales were higher this month, you’ll see a positive percentage change. If they were lower, you’d see a negative percentage change.
Percent Change in Excel is a handy tool for tracking changes in things like:
- Sales figures
- Inventory levels
- Website Traffic
- Stock prices
Syntax of Percent Change in Excel
In Excel, to calculate the percentage change between two values, you can use a simple formula. Here’s the syntax:
Both formulas you provided are correct ways to calculate percent change in Excel, though they are slightly different in their representation.
1. Percent Change = (New Value – Old Value) / Old Value
This formula calculates the absolute change between the new and old values and then divides it by the old value. It provides the relative change as a proportion of the old value.
2. Percent Change = New Value / Old Value – 1
This formula first calculates the ratio of the new value to the old value and then subtracts 1. It represents the relative change as a multiplier of the old value.
Both formulas yield the same result; they just represent the calculation differently. Users can choose the one that is most intuitive or convenient for their purposes.
How to Calculate Percent Change in Excel
Step 1: Open Excel and Enter Data
First, enter the initial and final values in two adjacent cells. Let’s say the initial value is in cell A1 and the final value is in cell B1.
Enter Data in Spreadsheet
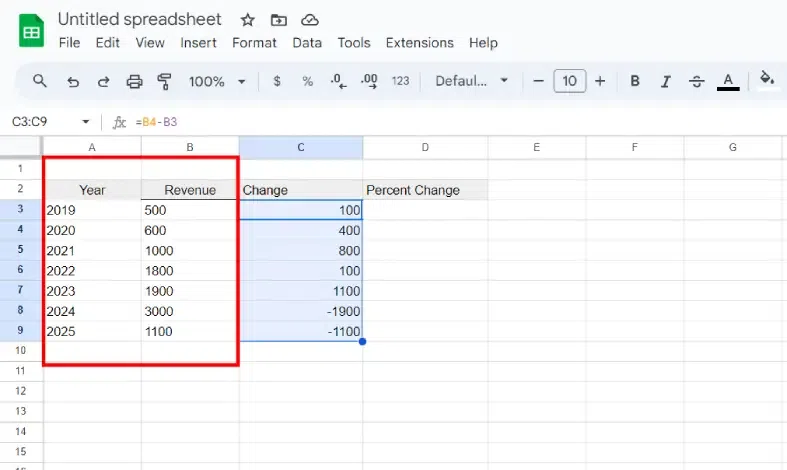
Step 2: Calculate Change
In a new cell, subtract the initial value from the final value. You can do this by typing “=B1-A1” in an empty cell. This will give you the difference between the final and initial values.
.webp) Calculate change >>
Calculate change >>
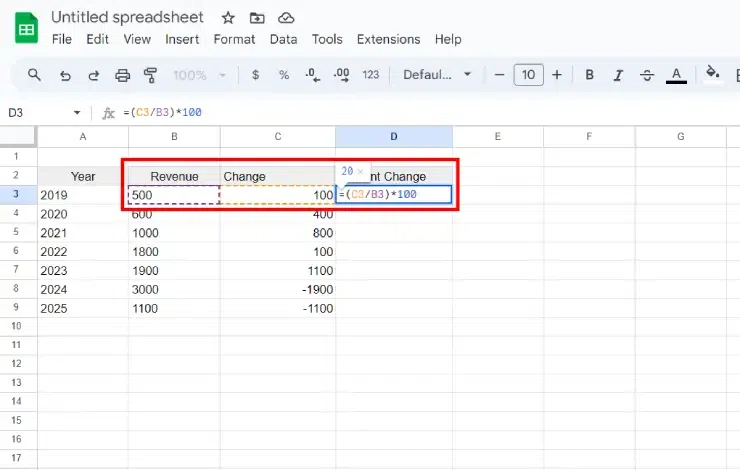
Step 3: Calculate Percent Change
In another new cell, divide the change value by the initial value. You can do this by typing “=C1/A1” where C1 is the cell containing the change value and A1 is the initial value.
Enter Formula for Percent Change
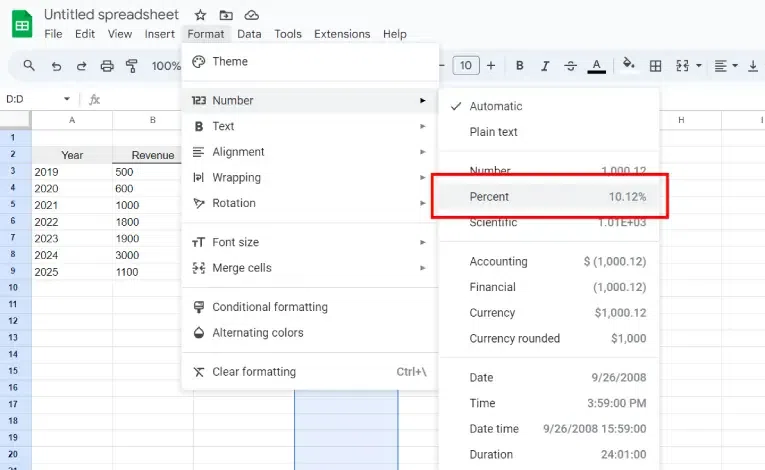
Step 4: Convert to Percentage
By default, Excel will display this as a decimal. To convert it to a percentage, click on the cell containing the percent change value, then click on the “Formate” tab in the Excel ribbon. In the “Number” group, click on the dropdown menu next to the percentage symbol (%) and select “Percentage”.
Change numbers to Percent>>
Step 5: Format(Optional)
You may also want to adjust the formatting of the cell to make it more visually appealing. You can do this by right-clicking on the cell, selecting “Format Cells”, and then choosing your desired formatting options.
Conclusion
Understanding how to calculate percent change in Excel is essential for analyzing data trends and tracking growth effectively. By following the steps mentioned here, you can easily compare values over time, aiding in making informed decisions based on valuable insights. Whether you’re dealing with financial data, sales figures, or any other numerical data, knowing how to calculate percentage change enables an accurate assessment of performance.
Whether it’s sales figures, inventory levels, website traffic, or stock prices you’re analyzing, mastering Excel’s percent change calculation empowers confident, data-driven decision-making. Start applying these techniques today to unlock actionable insights and drive success in your endeavors.
FAQs- How to Calculate Percent Change in Excel
Is there an Excel formula for percent change?
Yes, there are Excel formulas for percent change, including “(New Value – Old Value) / Old Value” and “New Value / Old Value – 1”. These formulas help calculate percentage change efficiently in Excel.
How do you calculate percent change?
To calculate percent change, subtract the initial value from the final value, then divide the result by the initial value, and finally multiply by 100 to express it as a percentage. The formula is (Final Value – Initial Value) / Initial Value * 100. This method helps in analyzing trends, tracking growth, and making informed decisions in various fields such as finance, sales, and data analysis.
How do you calculate the rate of change in Excel?
To calculate the rate of change in Excel, you can subtract the initial value from the final value and then divide the result by the initial value. Alternatively, you can use the formula “=(New Value – Old Value) / Old Value”. This process allows you to determine how much a value has changed relative to its original value, aiding in analyzing trends and making informed decisions.
Share your thoughts in the comments
Please Login to comment...