How to Calculate Five Number Summary in R?
Last Updated :
03 Apr, 2023
In this article, we will discuss how to calculate five number summary in R programming language.
Five number summary is also known as a boxplot. it will return five values that are :
- The minimum value present in the given data
- The first quartile value present in the given data
- The median value present in the given data
- The third quartile value present in the given data
- The maximum value present in the given data
Method 1 : Using fivenum()
This function will get the five-number summary of the given data
Syntax:
fivenum(data)
Example 1: Get the fivenumber summary of the vector
R
data=c(1:10)
print(fivenum(data))
|
Output:
[1] 1.0 3.0 5.5 8.0 10.0
Example 2: Get the fivenumber summary in the dataframe
R
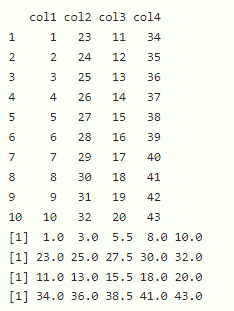
data=data.frame(col1=c(1:10),col2=c(23:32),
col3=c(11:20),col4=c(34:43))
print(data)
print(fivenum(data$col1))
print(fivenum(data$col2))
print(fivenum(data$col3))
print(fivenum(data$col4))
|
Output:
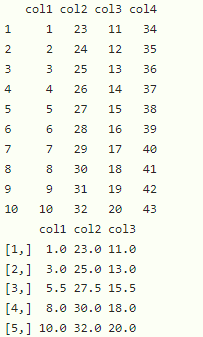
We can also get fivenumber summary from multiple columns at a time by using sapply with fivenum() function
Syntax:
sapply(dataframe, fivenum)
Example: Get fivenumber summary from multiple columns at a time
R
data=data.frame(col1=c(1:10),col2=c(23:32),
col3=c(11:20),col4=c(34:43))
print(data)
print(sapply(data[c('col1','col2','col3')], fivenum))
|
Output:
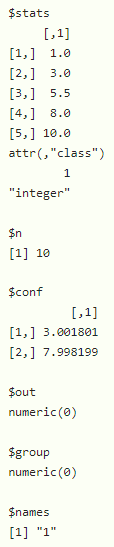
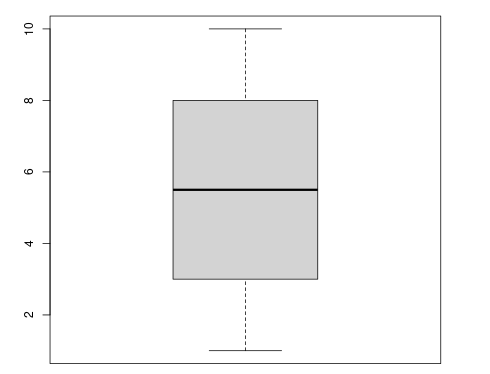
Method 2: Using boxplot()
This will generate a plot that represents minimum, maximum, median, first, and third quartiles
Syntax:
boxplot(data)
Example: Get the fivenum summary of the vector
R
data=c(1:10)
print(boxplot(data))
|
Output:
Share your thoughts in the comments
Please Login to comment...