How to calculate and plot a Cumulative Distribution function with Matplotlib in Python ?
Last Updated :
24 Jan, 2021
Prerequisites: Matplotlib
Matplotlib is a library in Python and it is a numerical — mathematical extension for the NumPy library. The cumulative distribution function (CDF) of a real-valued random variable X, or just distribution function of X, evaluated at x, is the probability that X will take a value less than or equal to x.
Properties of CDF:
- Every cumulative distribution function F(X) is non-decreasing
- If maximum value of the cdf function is at x, F(x) = 1.
- The CDF ranges from 0 to 1.
Method 1: Using the histogram
CDF can be calculated using PDF (Probability Distribution Function). Each point of random variable will contribute cumulatively to form CDF.
Example :
A combination set containing 2 balls which can be either red or blue can be in the following set.
{RR, RB, BR, BB}
t -> No of red balls.
P(x = t) -> t = 0 : 1 / 4 [BB]
t = 1 : 2 / 4 [RB, BR]
t = 2 : 1 / 4 [RR]
CDF :
F(x) = P(x<=t)
x = 0 : P(0) -> 1 / 4
x = 1 : P(1) + P(0) -> 3 / 4
x = 2 : P(2) + P(1) + P(0) -> 1
Approach
- Import modules
- Declare number of data points
- Initialize random values
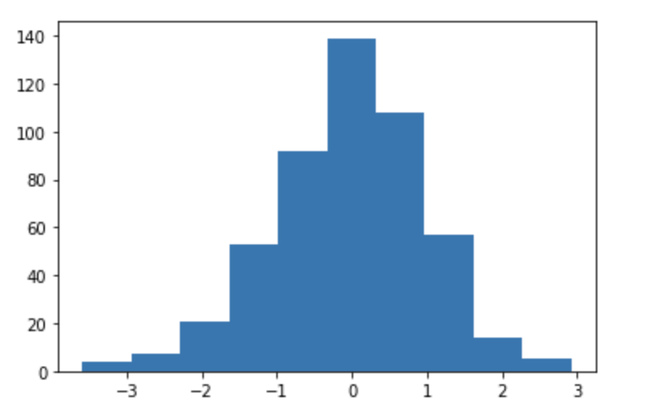
- Plot histogram using above data
- Get histogram data
- Finding PDF using histogram data
- Calculate CDF
- Plot CDF
Example:
Python3
import numpy as np
import matplotlib.pyplot as plt
import pandas as pd
%matplotlib inline
N = 500
data = np.random.randn(N)
count, bins_count = np.histogram(data, bins=10)
pdf = count / sum(count)
cdf = np.cumsum(pdf)
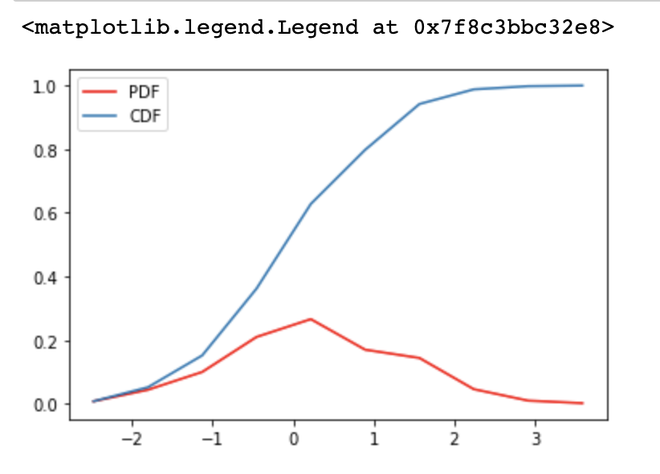
plt.plot(bins_count[1:], pdf, color="red", label="PDF")
plt.plot(bins_count[1:], cdf, label="CDF")
plt.legend()
|
Output:
Histogram plot of the PDF and CDF :
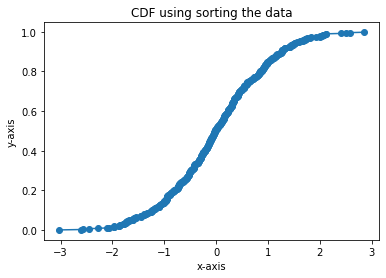
Plotted CDF:
CDF plotting
Method 2: Data sort
This method depicts how CDF can be calculated and plotted using sorted data. For this, we first sort the data and then handle further calculations.
Approach
- Import module
- Declare number of data points
- Create data
- Sort data in ascending order
- Get CDF
- Plot CDF
- Display plot
Example:
Python3
import numpy as np
import matplotlib.pyplot as plt
import pandas as pd
%matplotlib inline
N = 500
data = np.random.randn(N)
x = np.sort(data)
y = np.arange(N) / float(N)
plt.xlabel('x-axis')
plt.ylabel('y-axis')
plt.title('CDF using sorting the data')
plt.plot(x, y, marker='o')
|
Output:
Share your thoughts in the comments
Please Login to comment...