How to Add ChartJS in NextJS 13?
Last Updated :
06 May, 2024
Chart.js in Next.js is the package used to create interactive and visually appealing charts, such as line charts, bar charts, and more, seamlessly integrated into Next.js applications.
In this article, we will explore the demonstration of various charts in the NextJS application.
Steps to Create the Next.js Application
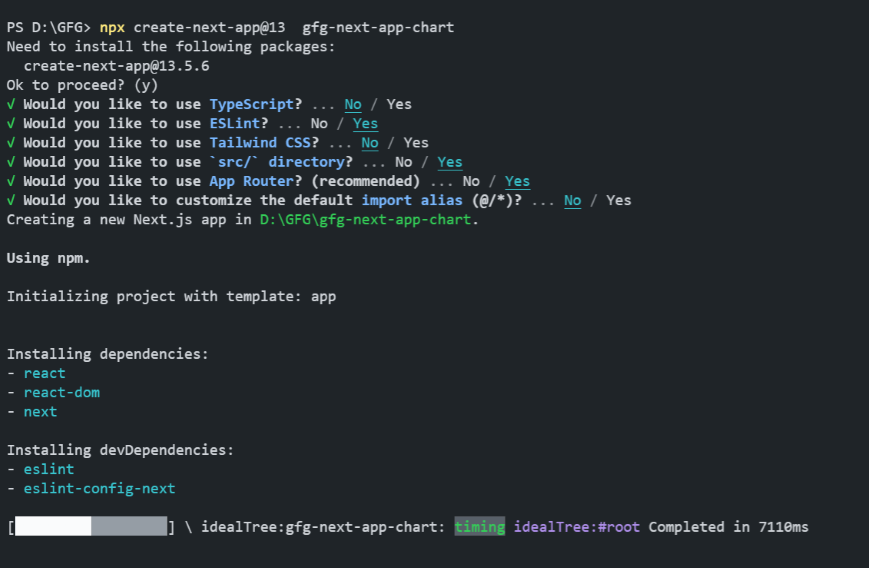
Step 1: Set up React Project using the Command:
npx create-next-app@13 gfg-next-app-chart
Step 2: Navigate to the Project folder using:
cd gfg-next-app-chart
Step 3: Install the ChartJS packages using the below command:
npm install chart.js react-chartjs-2
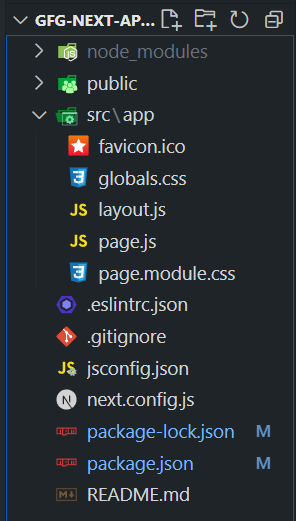
Project Structure:
The updated dependencies in package.json file will look like:
  "dependencies": {
    "chart.js": "^4.4.2",
    "next": "13.5.6",
    "react": "^18",
    "react-chartjs-2": "^5.2.0",
    "react-dom": "^18"
  },
Implementing Line Chart
In this approach, we are implementing a Line Chart using Chart.js in Next.js 13 with client-side rendering and dynamic import. The line component from react-chartjs-2 is dynamically imported to ensure it’s only rendered on the client side, and inline styles are used to set the dimensions of the chart container to 700×700 pixels.
Example: Below is an example of a Line Chart implemented using ChartJS Package in NextJS.
JavaScript
// page.js this is the entry point of application

"use client";
import dynamic from 'next/dynamic';
import 'chart.js/auto';
const Line = dynamic(() => import('react-chartjs-2').then((mod) => mod.Line), {
  ssr: false,
});
const data = {
  labels: ['January', 'February', 'March', 'April', 'May'],
  datasets: [
    {
      label: 'GeeksforGeeks Line Chart',
      data: [65, 59, 80, 81, 56],
      fill: false,
      borderColor: 'rgb(75, 192, 192)',
      tension: 0.1,
    },
  ],
};
const LineChart = () => {
  return (
    <div style={{ width: '700px', height: '700px' }}>
      <h1>Example 1: Line Chart</h1>
      <Line data={data} />
    </div>
  );
};
export default LineChart;
Start your application using the following command.
npm run dev
Output:
Implementing Bar Chart
In this approach, we are implementing a Bar Chart using Chart.js in Next.js 13 with client-side rendering and dynamic import. The Bar component from react-chartjs-2 is dynamically imported to ensure it’s only rendered on the client side, and inline styles are used to set the dimensions of the chart container to 700×700 pixels.
Example: Below is an example of a Bar Chart implemented using the ChartJS Package in NextJS.
JavaScript
// page.js this is the entry point of application

"use client";
import dynamic from 'next/dynamic';
import 'chart.js/auto';
const Bar = dynamic(() => import('react-chartjs-2').then((mod) => mod.Bar), {
  ssr: false,
});
const data = {
  labels: ['Red', 'Blue', 'Yellow', 'Green', 'Purple', 'Orange'],
  datasets: [
    {
      label: 'GeeksforGeeks Bar Chart',
      data: [12, 19, 3, 5, 2, 3],
      backgroundColor: [
        'rgba(255, 99, 132, 0.2)',
        'rgba(54, 162, 235, 0.2)',
        'rgba(255, 206, 86, 0.2)',
        'rgba(75, 192, 192, 0.2)',
        'rgba(153, 102, 255, 0.2)',
        'rgba(255, 159, 64, 0.2)',
      ],
      borderColor: [
        'rgba(255, 99, 132, 1)',
        'rgba(54, 162, 235, 1)',
        'rgba(255, 206, 86, 1)',
        'rgba(75, 192, 192, 1)',
        'rgba(153, 102, 255, 1)',
        'rgba(255, 159, 64, 1)',
      ],
      borderWidth: 1,
    },
  ],
};
const BarChart = () => {
  return (
    <div style={{ width: '700px', height: '700px' }}>
      <h1>Example 2: Bar Chart</h1>
      <Bar data={data} />
    </div>
  );
};
export default BarChart;
Start your application using the following command.
npm run dev
Output:
Share your thoughts in the comments
Please Login to comment...