How to add a grid on a figure in Matplotlib ?
Last Updated :
11 Jan, 2024
Matplotlib library is widely used for plotting graphs. In many graphs, we require to have a grid to improve readability. Grids are created by using grid() function in the Pyplot sublibrary. In this article, we will see how to add grid in Matplotlb.
Add a Grid on a Figure in Matplotlib
Below are the ways by which we can see how to add grid in Matplotlib in Python:
Add a Grid on a Figure in Matplotlib Using scatter()
In this example, the code uses the Matplotlib library to create a scatter plot of y = x^2 with points generated using NumPy. The first part uses the pyplot interface to create a scatter plot and grid on the y-axis. The second part creates a figure and axis explicitly, sets ticks on both the x and y axes, plots the scatter graph, and specifies the default grid on the figure.
Python3
import matplotlib.pyplot as plt
import numpy
x = numpy.arange(0, 1, 0.1)
y = numpy.power(x, 2)
plt.scatter(x, y)
plt.grid(axis='y')
plt.show()
fig = plt.figure()
ax = fig.gca()
ax.set_xticks(numpy.arange(0, 1, 0.1))
ax.set_yticks(numpy.arange(0, 1, 0.1))
ax.scatter(x, y)
ax.grid()
ax.show()
|
Output:


Matplotlib Adding Grid Lines Using Plot()
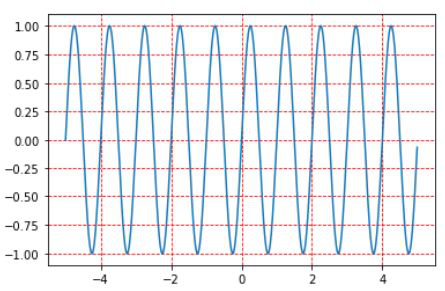
In this example, the given code uses the Matplotlib library to create a line graph of the sine function. It defines an array ‘x’ from -5 to 5 with a step size of 0.01 and calculates ‘y’ as the sine of 2π times ‘x’. The code then plots the line graph, sets a red dashed grid, and displays the plot.
Python3
import matplotlib.pyplot as plt
import numpy as np
x = np.arange(-5, 5, 0.01)
y = np.sin(2*np.pi*x)
plt.plot(x, y)
plt.grid(color='r', linestyle='--')
plt.show()
|
Output:
Add a Matplotlib Grid on a Figure Using add_gridspec()
In this example, the code uses Matplotlib and add_gridspec() to create a figure with a 2×2 grid of subplots. It defines three subplots (line plot, scatter plot, and bar plot) within this grid and plots data on each. Additionally, it adds a dashed grid to all subplots, enhancing visualization. Finally, the `plt.show()` command displays the figure with the configured subplots.
Python3
import matplotlib.pyplot as plt
from matplotlib.gridspec import GridSpec
fig = plt.figure()
gs = GridSpec(2, 2)
ax1 = fig.add_subplot(gs[0, 0])
ax2 = fig.add_subplot(gs[0, 1])
ax3 = fig.add_subplot(gs[1, :])
ax1.plot([1, 2, 3], [4, 5, 6])
ax2.scatter([1, 2, 3], [4, 5, 6])
ax3.bar([1, 2, 3], [4, 5, 6])
for ax in [ax1, ax2, ax3]:
ax.grid(True, linestyle='--', linewidth=0.5, color='gray')
plt.show()
|
Output:

Using add_gridspec For More Control
Share your thoughts in the comments
Please Login to comment...