Highlight the maximum value in last two columns in Pandas – Python
Last Updated :
26 Jul, 2020
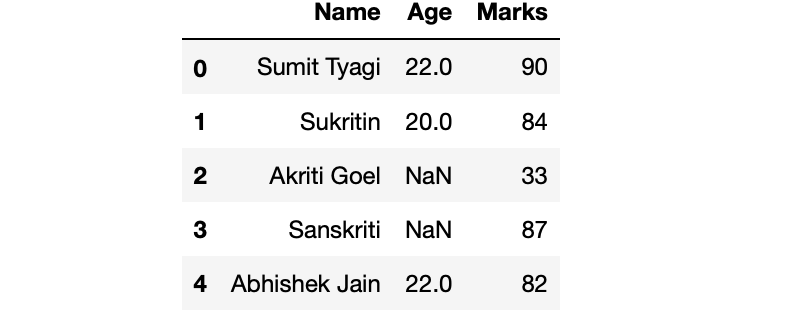
In this article, we will discuss how to highlight the maximum values in Pandas Dataframe. Let’s first make a dataframe:
Example:
Python3
import pandas as pd
import numpy as np
dict = {'Name': ['Sumit Tyagi', 'Sukritin', 'Akriti Goel',
'Sanskriti', 'Abhishek Jain'],
'Age': [22, 20, np.nan, np.nan, 22],
'Marks': [90, 84, 33, 87, 82]}
df = pd.DataFrame(dict)
df
|
Output:
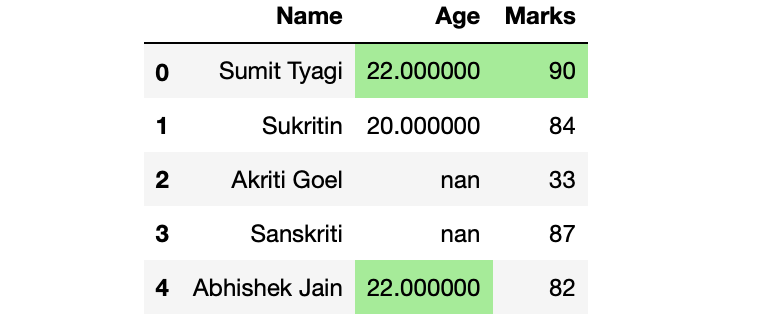
Now, come to the highlighting part. Our objective is to highlight cells with maximum values in last 2 columns.
Method 1: Highlighting Cell with maximum value in last 2 columns
We will do this by using the highlight_max() method of DataFrame property. highlight_max() method takes 3 arguments,
- subset: name of the columns of which you want to find the maximum
- color: name of the color with which you want to highlight the cell
- axis: (0/1) based on which axis you want to find the maximum.
Example:
Python3
df.style.highlight_max(subset = ['Age', 'Marks'],
color = 'lightgreen', axis = 0)
|
Output:
Method 2: Instead of using column names we generalise it to last two columns
Example:
Python3
df.style.highlight_max(subset = df.columns[-2:],
color = 'lightgreen', axis = 0)
|
Output:
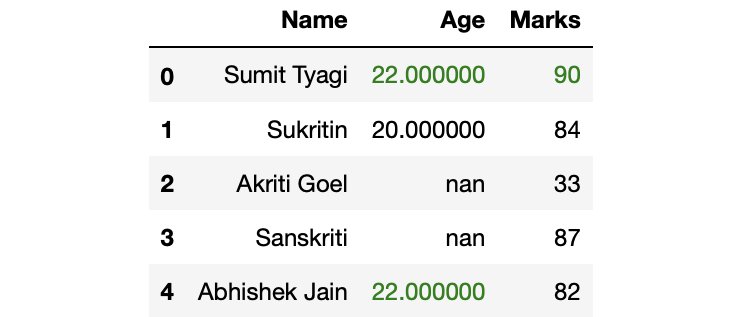
Method 3: Highlighting the text instead of cell
Example:
Python3
def highlight_max(s):
is_max = s == s.max()
return ['color: green' if cell else '' for cell in is_max]
df.style.apply(highlight_max, subset = df.columns[-2:])
|
Output:
Method 4: Highlighting cell with maximum values
Example:
Python3
def highlight_max(s):
is_max = s == s.max()
return ['background: lightgreen' if cell else '' for cell in is_max]
df.style.apply(highlight_max, subset = df.columns[-2:])
|
Output:
Share your thoughts in the comments
Please Login to comment...