Dark Mode for Visualisations Using ggdark in R
Last Updated :
30 Dec, 2022
Being a developer Dark mode is one of the favorite options of the majority. Some consider this good for the eyes and some for cosmetic reasons. So, in this article, we are going to look at such a package in the R Programming Language which enables us to introduce different Dark themes in our visualizations.
The ggdark is a package that was built on ggplot2 to produce dark theme-based plots. The ggdark package includes dark_mode(), dark_theme_minimal(), and other functions. By applying these functions the colors of the plot are inverted to ensure the plot is visible. Install and load the required packages.
R
install.packages("ggplot2")
install.packages("ggdark")
library(ggplot2)
library(ggdark)
|
dark_mode(): Used to activate dark mode on a ‘ggplot2’ theme.
Syntax:
dark_mode(.theme = theme_get(), verbose = TRUE, force_geom_invert = FALSE)
Where,
- .theme – ggplot2 theme object
- verbose – print messages (default: TRUE)
- force_geom_invert – Force the inversion of geom defaults for fill and color/colour (default: FALSE)
R
data(iris)
ggplot2::ggplot(iris, aes(x = Sepal.Width, fill = Species)) +
geom_density(alpha = 0.7) +
ggdark::dark_mode() +
theme(legend.position = "bottom")
|
Output:

Plot with dark_mode()
dark_theme_gray(): This is one of the dark versions of complete themes from ‘ggplot2’ that are used to control all non-data displays.
Syntax:
dark_theme_gray(base_size, base_family, base_line_size, base_rect_size)
Where,
- base_size – base font size
- base_family – base font family
- base_line_size – base size for line elements
- base_rect_size – base size for rect elements
R
data(iris)
ggplot2::ggplot(iris, aes(x = Sepal.Width,y=Petal.Width,
fill = Species)) +
geom_bar(stat="identity") +
ggdark::dark_theme_gray() +
theme(legend.position = "top")+
ggtitle("BarPlot using ggdark")
|
Output:

Plot with dark_theme_gray()
dark_theme_minimal(): This is one of the dark versions of complete themes from ‘ggplot2‘ that are used to control all non-data displays.
Syntax:
dark_theme_minimal(base_size, base_family, base_line_size, base_rect_size)
Where,
- base_size – base font size
- base_family – base font family
- base_line_size – base size for line elements
- base_rect_size – base size for rect elements
R
data(iris)
ggplot2::ggplot(iris, aes(x = Sepal.Width,
y=Petal.Width,
color = Species)) +
geom_point() +
ggdark::dark_theme_minimal() +
theme(legend.position = "right")+
ggtitle("DotPlot using ggdark")
|
Output:
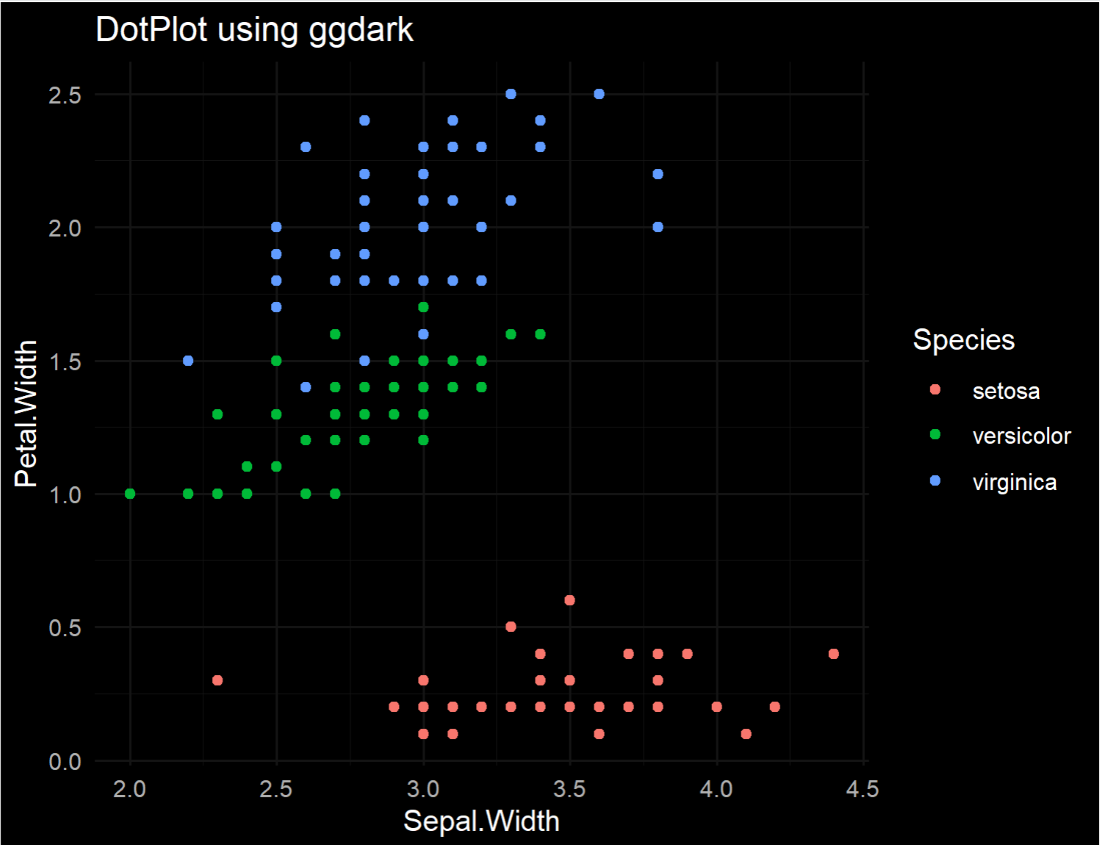
Plot with dark_theme_minimal()
Share your thoughts in the comments
Please Login to comment...