Creating Tables with PrettyTable Library – Python
Last Updated :
18 Aug, 2020
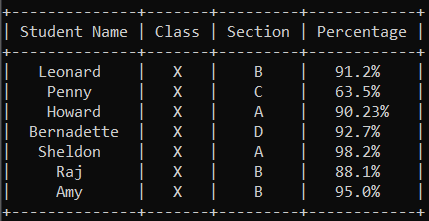
PrettyTable class inside the prettytable library is used to create relational tables in Python. For example, the table below has been created using this library, in Command Prompt on Windows.
Installing the Library:
pip install prettytable
Let’s create the sample table using the prettytable library in Python.
Creating the Table: Row-Wise
Python3
from prettytable import PrettyTable
myTable = PrettyTable(["Student Name", "Class", "Section", "Percentage"])
myTable.add_row(["Leanord", "X", "B", "91.2 %"])
myTable.add_row(["Penny", "X", "C", "63.5 %"])
myTable.add_row(["Howard", "X", "A", "90.23 %"])
myTable.add_row(["Bernadette", "X", "D", "92.7 %"])
myTable.add_row(["Sheldon", "X", "A", "98.2 %"])
myTable.add_row(["Raj", "X", "B", "88.1 %"])
myTable.add_row(["Amy", "X", "B", "95.0 %"])
print(myTable)
|
Output
+--------------+-------+---------+------------+
| Student Name | Class | Section | Percentage |
+--------------+-------+---------+------------+
|   Leanord    |   X   |    B    |   91.2%    |
|    Penny     |   X   |    C    |   63.5%    |
|    Howard    |   X   |    A    |   90.23%   |
|  Bernadette  |   X   |    D    |   92.7%    |
|   Sheldon    |   X   |    A    |   98.2%    |
|     Raj      |   X   |    B    |   88.1%    |
|     Amy      |   X   |    B    |   95.0%    |
+--------------+-------+---------+------------+
Creating the Table: Column-Wise
Python3
from prettytable import PrettyTable
columns = ["Student Name", "Class", "Section", "Percentage"]
myTable = PrettyTable()
myTable.add_column(columns[0], ["Leanord", "Penny", "Howard",
"Bernadette", "Sheldon", "Raj", "Amy"])
myTable.add_column(columns[1], ["X", "X", "X", "X", "X", "X", "X"])
myTable.add_column(columns[2], ["B", "C", "A", "D", "A", "B", "B"])
myTable.add_column(columns[3], ["91.2 %", "63.5 %", "90.23 %", "92.7 %",
"98.2 %", "88.1 %", "95.0 %"])
print(myTable)
|
Output
+--------------+-------+---------+------------+
| Student Name | Class | Section | Percentage |
+--------------+-------+---------+------------+
|   Leanord    |   X   |    B    |   91.2%    |
|    Penny     |   X   |    C    |   63.5%    |
|    Howard    |   X   |    A    |   90.23%   |
|  Bernadette  |   X   |    D    |   92.7%    |
|   Sheldon    |   X   |    A    |   98.2%    |
|     Raj      |   X   |    B    |   88.1%    |
|     Amy      |   X   |    B    |   95.0%    |
+--------------+-------+---------+------------+
Deleting Rows
myTable.del_row(0)
This will delete the first row from the table, i.e, the rows follow standard indexing starting from index 0.
Clearing the Table
myTable.clear_rows()
This will clear the entire table (Only the Column Names would remain).
There are many advanced features associated with these tables, like converting these tables to HTML or converting a CSV to a PrettyTable. Those functions would be covered in a separate article.
Share your thoughts in the comments
Please Login to comment...