Compute the Logistic Density in R Programming – dlogis() Function
Last Updated :
25 Jun, 2020
dlogis() function in R Language is used to compute logistic density of the distribution. It also creates a plot of the density of the logistic distribution.
Syntax: dlogis(vec)
Parameters:
vec: Vector of x-values for density
Example 1:
x <- seq(-1, 1, by = 0.1)
y <- dlogis(x)
y
|
Output:
 [1] 0.1966119 0.2055003 0.2139097 0.2217129 0.2287842 0.2350037 0.2402607
 [8] 0.2444583 0.2475166 0.2493760 0.2500000 0.2493760 0.2475166 0.2444583
[15] 0.2402607 0.2350037 0.2287842 0.2217129 0.2139097 0.2055003 0.1966119
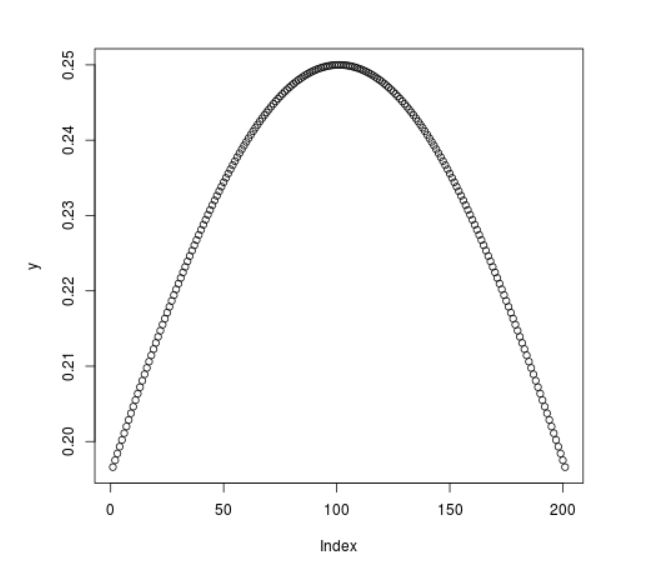
Example 2:
x <- seq(-1, 1, by = 0.01)
y <- dlogis(x)
plot(y)
|
Output:
Share your thoughts in the comments
Please Login to comment...