Compute Cumulative Logistic Density in R Programming – plogis() Function
Last Updated :
25 Jun, 2020
plogis() function in R Language is used to compute logistic cumulative density of the distribution. It also creates a plot of the density of the logistic cumulative distribution.
Syntax: plogis(vec)
Parameters:
vec: Vector of x-values for density
Example 1:
x <- seq(-1, 1, by = 0.1)
y <- plogis(x)
y
|
Output:
 [1] 0.2689414 0.2890505 0.3100255 0.3318122 0.3543437 0.3775407 0.4013123
 [8] 0.4255575 0.4501660 0.4750208 0.5000000 0.5249792 0.5498340 0.5744425
[15] 0.5986877 0.6224593 0.6456563 0.6681878 0.6899745 0.7109495 0.7310586
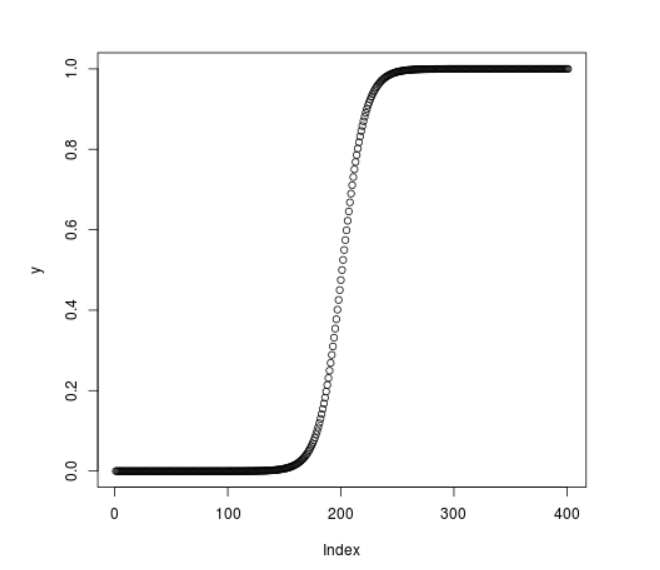
Example 2:
x <- seq(-20, 20, by = 0.1)
y <- plogis(x)
plot(y)
|
Output:
Share your thoughts in the comments
Please Login to comment...