Compute Cumulative Cauchy Density in R Programming – pcauchy() Function
Last Updated :
25 Jun, 2020
pcauchy() function in R Language is used to calculate the cumulative cauchy density. It also creates a density plot of cauchy cumulative distribution.
Syntax: pcauchy(vec, scale)
Parameters:
vec: x-values for cauchy function
scale: Scale for plotting
Example 1:
x <- seq(0, 2, by = 0.2)
y <- pcauchy(x, scale = 5)
y
|
Output:
 [1] 0.5000000 0.5127256 0.5254107 0.5380154 0.5505015 0.5628330 0.5749763
 [8] 0.5869014 0.5985815 0.6099938 0.6211189
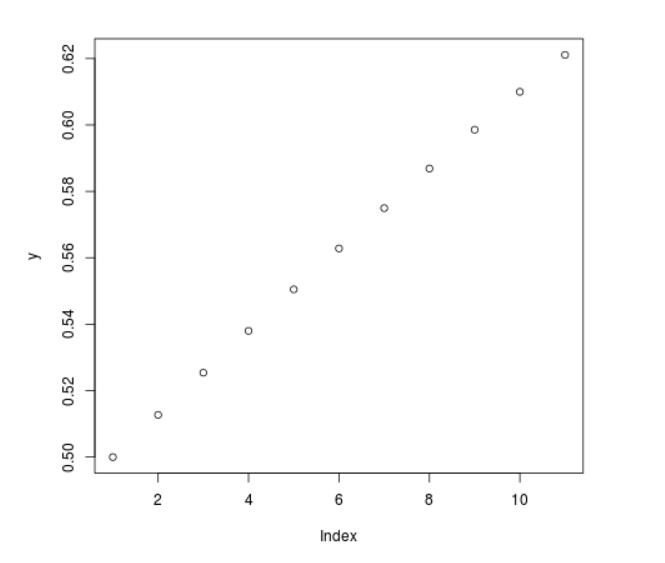
Example 2:
x <- seq(0, 2, by = 0.2)
y <- pcauchy(x, scale = 5)
plot(y)
|
Output:
Share your thoughts in the comments
Please Login to comment...