Apache Kafka Load Testing Using JMeter
Last Updated :
20 Mar, 2024
Apache Kafka is designed as a key component with real-time data flows and event-driven scheduling to accelerate data flow to applications. In this article, we will explore how to incorporate JMeter into Apache Kafka tests but understand what it does before we begin the main contents.
- Producer: In Kafka, a producer is responsible for publishing messages or records to topics. These messages could represent anything from log data to transaction information. Producers play a vital role in the Kafka ecosystem, initiating the flow of data into the Kafka cluster.
- Consumer: Consumers, on the other hand, subscribe to topics and process the messages produced by the producers. They play a crucial role in the real-time processing of data, making Kafka an ideal solution for scenarios where low latency and high throughput are essential.
- Topic: Topic is a fundamental concept that represents a category or feed name to which records (messages) are published. Topics are used to organize and categorize the flow of data within Kafka. When producers send messages to Kafka, they specify the topic to which the messages should be published. On the consumer side, consumers subscribe to specific topics to retrieve and process the messages of interest.
Setting up JMeter and Kafka in Windows
Below are the steps to set up JMeter and Kafka in Windows.
Step 1: Install JMeter
To set up JMeter on your system, visit the Apache JMeter website to download the latest binary file. Afterward, extract the downloaded file. Additionally, acquire the JMeter Plugins Manager from its dedicated website and integrate it into your JMeter installation by placing the downloaded JAR file in the “lib/ext” directory.
Step 2: Install and Configure Kafka
To set up Kafka on your system, download Kafka from the Apache Kafka website and extracting the downloaded file to a directory of your preference. It is recommended to keep this file directly under the C drive to avoid potential errors. Next, navigate to the Kafka directory in a command prompt and start the Kafka environment by starting the ZooKeeper service.
C:\kafka>.\bin\windows\zookeeper-server-start.bat .\config\zookeeper.properties
Now start the Kafka broker service using below command:
C:\kafka>.\bin\windows\kafka-server-start.bat .\config\server.properties
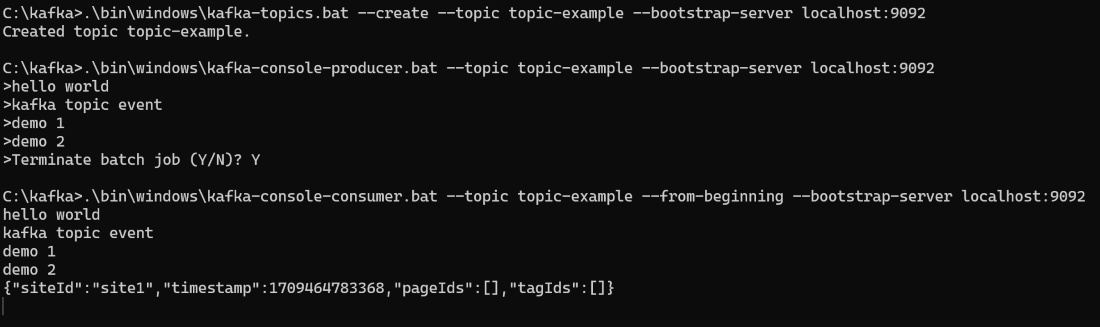
Next step is to create a Kafka topic. Create a topic named “topic-example” using below command:
C:\kafka>.\bin\windows\kafka-topics.bat --create --topic topic-example --bootstrap-server localhost:9092
Now see the Kafka console producer to write events:
C:\kafka>.\bin\windows\kafka-console-producer.bat --topic topic-example --bootstrap-server localhost:9092
>hello world
>kafka topic event
To read the events use the Kafka console consumer to read events:
C:\kafka>.\bin\windows\kafka-console-consumer.bat --topic topic-example --from-beginning --bootstrap-server localhost:9092

Step 3: Creating Test Plan with JMeter for Kafka Testing
Launch JMeter by navigating to the “bin” directory and running “jmeter.bat.” Right-click on the Test Plan, go to “Add” -> “Sampler” -> “JP Kafka Sampler.” Configure the Kafka Producer and Consumer components with Kafka server details, topics, and other relevant settings. Design test scenarios by specifying the number of threads, ramp-up periods, and loop counts within the Thread Group. A sample test configuration are shown below.
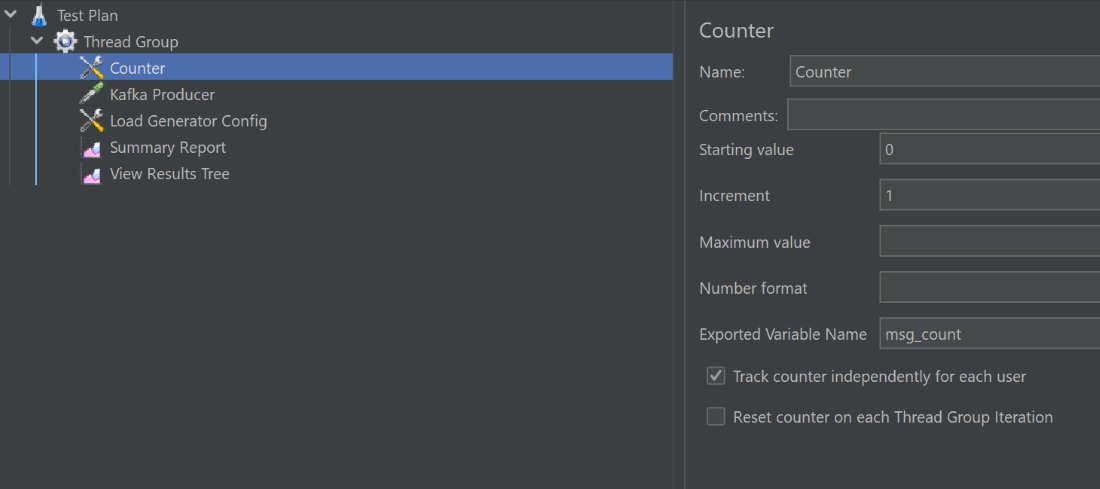
- Thread Group: Thread Group in JMeter is nothing but a virtual user group. It simulates the number of users and the way they interact with the application. Each thread in the group represents a virtual user, and the properties of the Thread Group define how many users will be simulated, how they will behave, and how the load will be distributed over time.
- Counter: The Counter is a JMeter pre-processor that allows you to increment or decrement a variable value with each thread iteration. It’s useful for generating unique values for each thread, such as a user ID or any other variable that needs to be unique for each user during the test.
Java Request(Kafka Producer):

Java Request sampler allows to execute Java code as part of the test plan. Here, using it to simulate Kafka producer behavior. We can use this sampler to write custom Java code that interacts with the Kafka broker, producing or consuming messages.
Load Generator Config:

In Kafka load testing scenario, we would configure settings related to the number of producers, consumers, message size, throughput, etc. It could also include any configuration specific to the load testing requirements (config.json file).
Summary Report:

The Summary Report is a listener in JMeter that provides a summary of the test results, including key metrics such as throughput, response times, error rates, and more. It helps us analyze the overall performance of our test. This information is crucial for understanding how well our Kafka system is handling the specified load.
View Result Tree:
The View Result Tree is another listener in JMeter that allows you to view the detailed results of each sample (request) executed during the test. It can be useful for debugging and analyzing individual request/response details. However, it’s recommended not to use it during high load tests, as it consumes a significant amount of resources.
config.json file:
Place this sample config file in the same folder where you have saved your jmx file or provide complete path in Filename.
This file can be anything that client wants to send like username and password. Basically this is the file which creates load to the system.
{
  "site1": {
    "weight": 0.6,
    "pages": {
      "123": {
        "weight": 0.7,
        "tags": [
          123,
          456
        ]
      },
      "234": {
        "weight": 0.1,
        "tags": [
          123,
          456,
          743,
          899
        ]
      }
    }
  },
  "site2": {
    "weight": 0.4,
    "pages": {
      "123": {
        "weight": 0.7,
        "tags": [
          123,
          234
        ]
      }
    }
  }
}
Step 4: Run the Load Test
Now to start the test click the “Run” menu or use the shortcut (Ctrl + R) to initiate the test. We can also click on Thread Group and click on validate script to run the jmx scripts. During the test, monitor key performance metrics in JMeter listeners.
After the test completes, inspect detailed results using the “View Results Tree” or other listeners. Additionally utilize JMeter listeners to generate summary reports, graphs, and visualizations. After analyzing the results look for performance bottlenecks such as high response times, low throughput, or errors in the generated reports and fine-tune Kafka and JMeter configurations based on the analysis to optimize performance.
Share your thoughts in the comments
Please Login to comment...