Python – seaborn.residplot() method
Last Updated :
17 Aug, 2020
Seaborn is an amazing visualization library for statistical graphics plotting in Python. It provides beautiful default styles and color palettes to make statistical plots more attractive. It is built on the top of matplotlib library and also closely integrated to the data structures from pandas.
seaborn.residplot() :
This method is used to plot the residuals of linear regression. This method will regress y on x and then draw a scatter plot of the residuals. You can optionally fit a lowess smoother to the residual plot, which can help in determining if there is a structure to the residuals.
Syntax: seaborn.residplot(x, y, data=None, lowess=False, x_partial=None, y_partial=None, order=1,
robust=False, dropna=True, label=None, color=None, scatter_kws=None, line_kws=None, ax=None)
Parameters: The description of some main parameters are given below:
- x: Data or column name in ‘data’ for the predictor variable.
- y: Data or column name in ‘data’ for the response variable.
- data: (optional) DataFrame having `x` and `y` are column names.
- lowess: (optional) Fit a lowess smoother to the residual scatterplot.
- dropna: (optional) This parameter takes boolean value. If True, ignore observations with missing data when fitting and plotting.
Return: Axes with the regression plot.
Below is the implementation of above method:
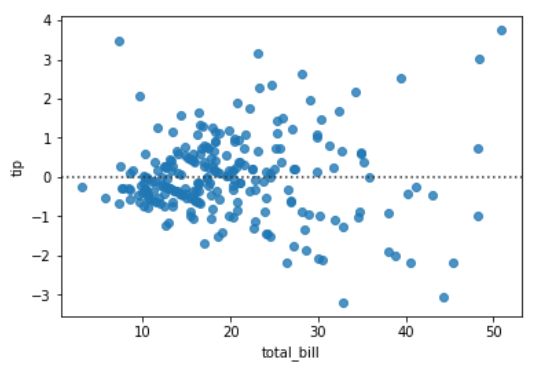
Example 1:
Python3
import seaborn as sns
import matplotlib.pyplot as plt
data = sns.load_dataset("tips")
sns.residplot(x = "total_bill",
y = "tip",
data = data)
plt.show()
|
Output:
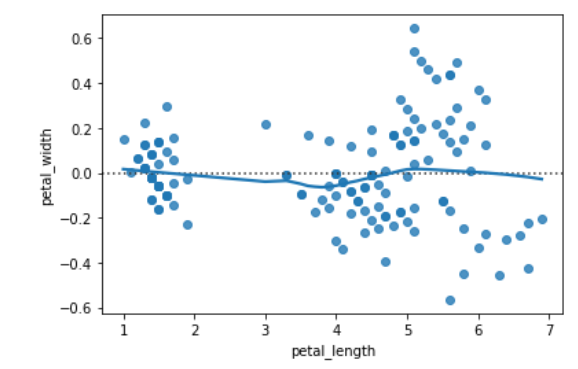
Example 2:
Python3
import seaborn as sns
import matplotlib.pyplot as plt
data = sns.load_dataset("iris")
sns.residplot(x = "petal_length",
y = "petal_width",
data = data,
lowess = True)
plt.show()
|
Output:
Share your thoughts in the comments
Please Login to comment...