Matplotlib.figure.Figure.legend() in Python
Last Updated :
03 May, 2020
Matplotlib is a library in Python and it is numerical – mathematical extension for NumPy library. The figure module provides the top-level Artist, the Figure, which contains all the plot elements. This module is used to control the default spacing of the subplots and top level container for all plot elements.
matplotlib.figure.Figure.legend() method
The legend() method figure module of matplotlib library is used to place a legend on the figure.
Syntax: legend(self, *args, **kwargs)
Parameters: This method accept the following parameters that are discussed below:
- handles :This parameter is the list of Artists (lines, patches) to be added to the legend.
- labels :This parameter is the list of labels to show next to the artists.
Returns: This method returns the matplotlib.legend.Legend instance.
Below examples illustrate the matplotlib.figure.Figure.legend() function in matplotlib.figure:
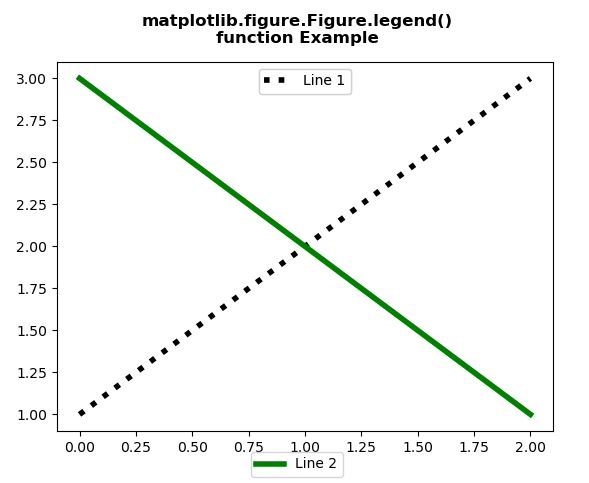
Example 1:
import matplotlib.pyplot as plt
fig, ax = plt.subplots()
line1, = ax.plot([1, 2, 3],
label ="Line 1",
color ="black",
linewidth = 4,
linestyle =':')
line2, = ax.plot([3, 2, 1],
label ="Line 2",
color ="green",
linewidth = 4)
first_legend = ax.legend(handles =[line1],
loc ='upper center')
ax.add_artist(first_legend)
fig.legend(handles =[line2], loc ='lower center')
fig.suptitle(
, fontweight ="bold")
plt.show()
|
Output:
Example 2:
import numpy as np
np.random.seed(19680801)
import matplotlib.pyplot as plt
fig, ax = plt.subplots()
for color in [ 'tab:green', 'tab:blue', 'tab:orange']:
n = 70
x, y = np.random.rand(2, n)
scale = 1000.0 * np.random.rand(n)
ax.scatter(x, y, c = color, s = scale, label = color,
alpha = 0.35)
fig.legend()
ax.grid(True)
fig.suptitle(
, fontweight ="bold")
plt.show()
|
Output:

Share your thoughts in the comments
Please Login to comment...