Python | Visualize missing values (NaN) values using Missingno Library
Last Updated :
04 Jul, 2019
In the case of a real-world dataset, it is very common that some values in the dataset are missing. We represent these missing values as NaN (Not a Number) values. But to build a good machine learning model our dataset should be complete. That’s why we use some imputation techniques to replace the NaN values with some probable values. But before doing that we need to have a good understanding of how the NaN values are distributed in our dataset.
Missingno library offers a very nice way to visualize the distribution of NaN values. Missingno is a Python library and compatible with Pandas.
Install the library –
pip install missingno
To get the dataset used in the code, click here.
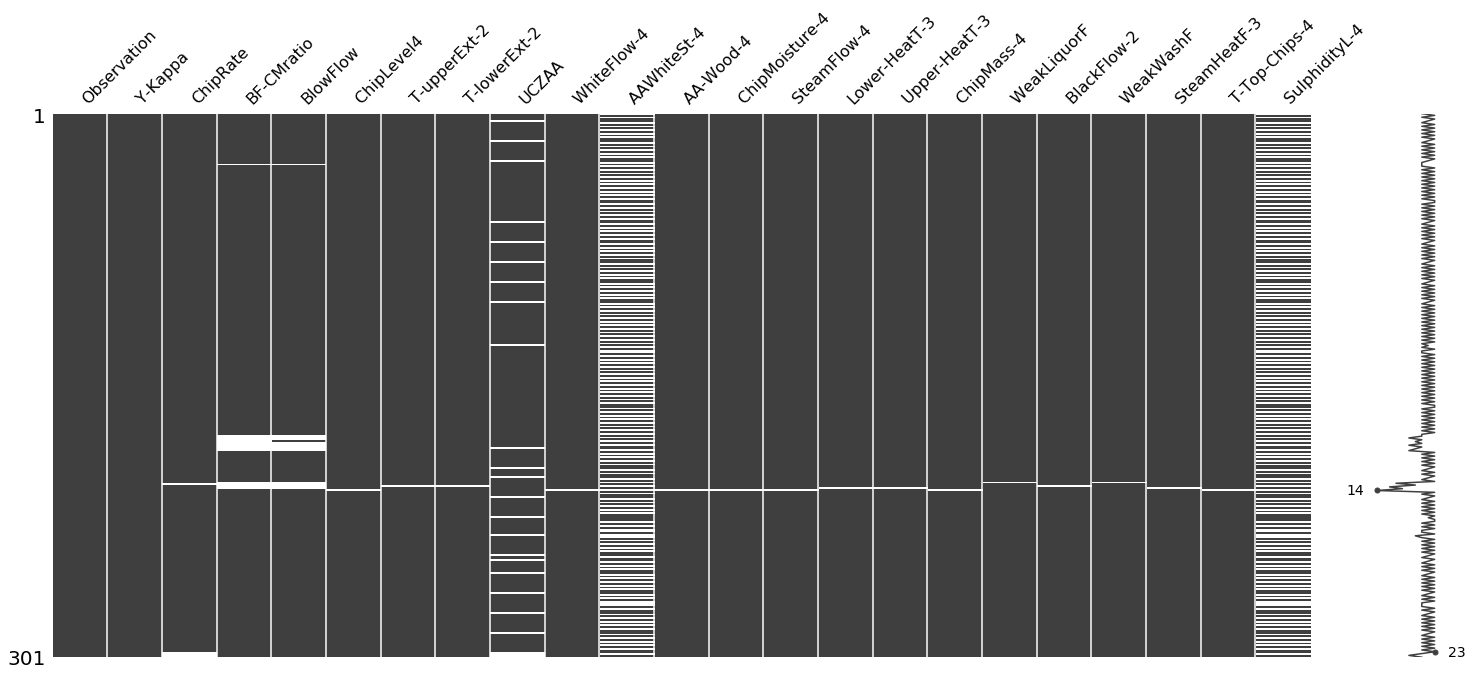
Matrix :
Using this matrix you can very quickly find the pattern of missingness in the dataset. In our example, the columns AAWhiteSt-4 and SulphidityL-4 have a similar pattern of missing values while UCZAA shows a different pattern.
import pandas as pd
import missingno as msno
df = pd.read_csv("kamyr-digester.csv")
msno.matrix(df)
|
Output:
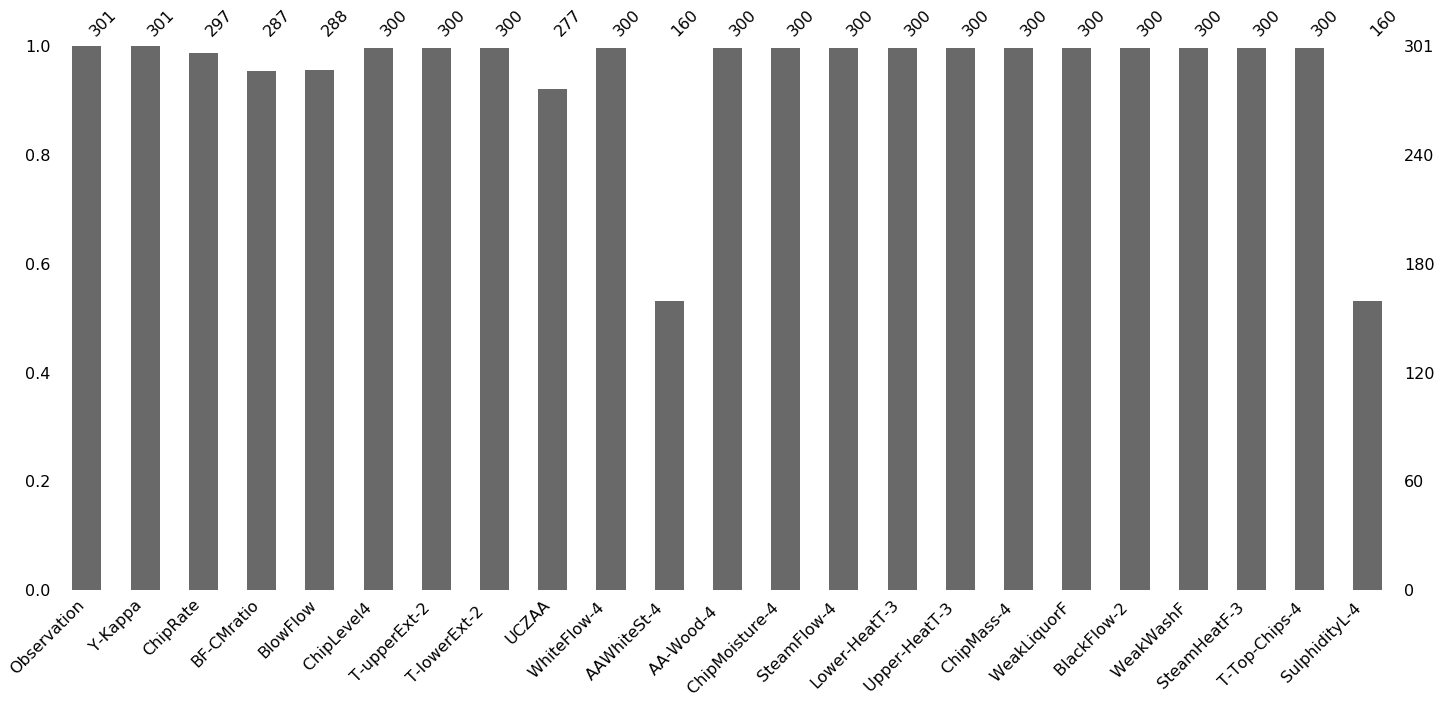
Bar Chart :
This bar chart gives you an idea about how many missing values are there in each column. In our example, AAWhiteSt-4 and SulphidityL-4 contain the most number of missing values followed by UCZAA.
import pandas as pd
import missingno as msno
df = pd.read_csv("kamyr-digester.csv")
msno.bar(df)
|
Output:
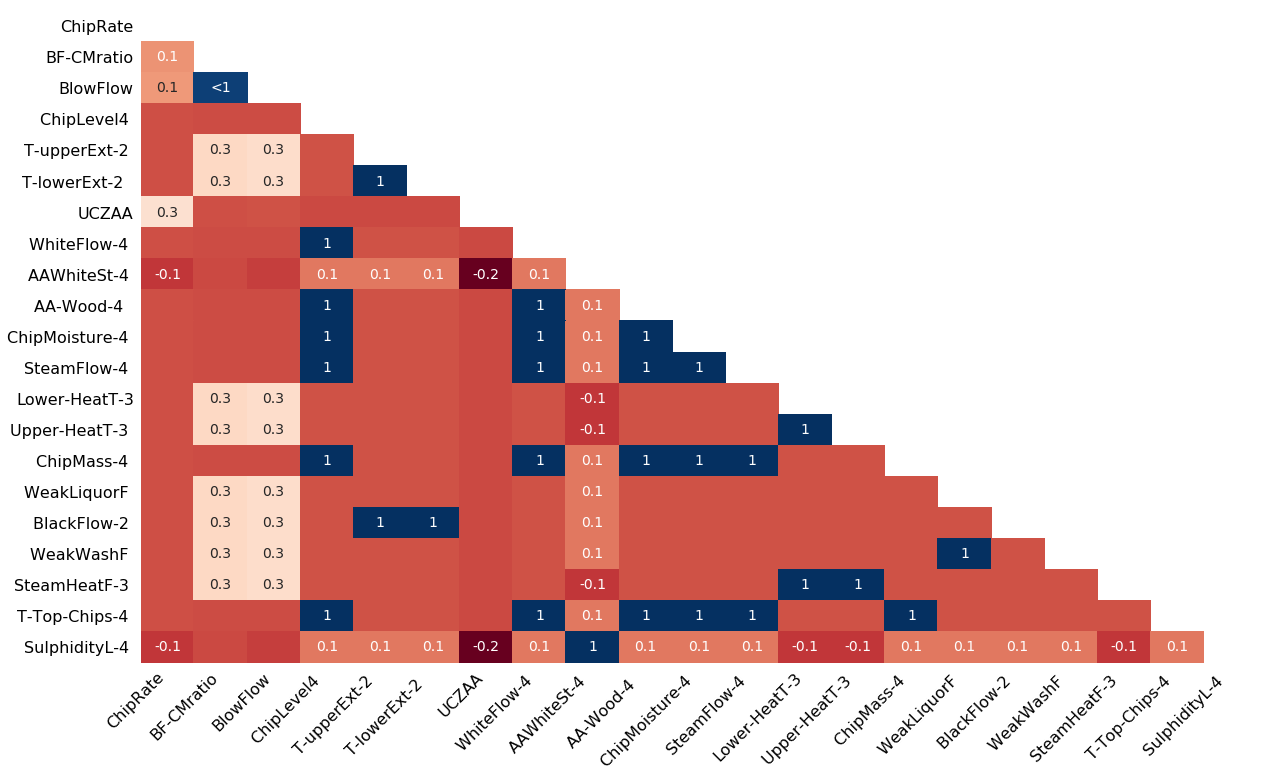
Heatmap :
Heatmap shows the correlation of missingness between every 2 columns. In our example, the correlation between AAWhiteSt-4 and SulphidityL-4 is 1 which means if one of them is present then the other one must be present.
A value near -1 means if one variable appears then the other variable is very likely to be missing.
A value near 0 means there is no dependence between the occurrence of missing values of two variables.
A value near 1 means if one variable appears then the other variable is very likely to be present.
import pandas as pd
import missingno as msno
df = pd.read_csv("kamyr-digester.csv")
msno.heatmap(df)
|
Output:
Reference : https://github.com/ResidentMario/missingno
Share your thoughts in the comments
Please Login to comment...