Python | Visualize graphs generated in NetworkX using Matplotlib
Last Updated :
14 Aug, 2021
Prerequisites: Generating Graph using Network X, Matplotlib Intro
In this article, we will be discussing how to plot a graph generated by NetworkX in Python using Matplotlib. NetworkX is not a graph visualizing package but basic drawing with Matplotlib is included in the software package.
Step 1 : Import networkx and matplotlib.pyplot in the project file.
Python3
import networkx as nx
import matplotlib.pyplot as plt
|
Step 2 : Generate a graph using networkx.
Step 3 : Now use draw() function of networkx.drawing to draw the graph.
Step 4 : Use savefig(“filename.png”) function of matplotlib.pyplot to save the drawing of graph in filename.png file.
Below is the Python code:
Python3
import networkx as nx
import matplotlib.pyplot as plt
g = nx.Graph()
g.add_edge(1, 2)
g.add_edge(2, 3)
g.add_edge(3, 4)
g.add_edge(1, 4)
g.add_edge(1, 5)
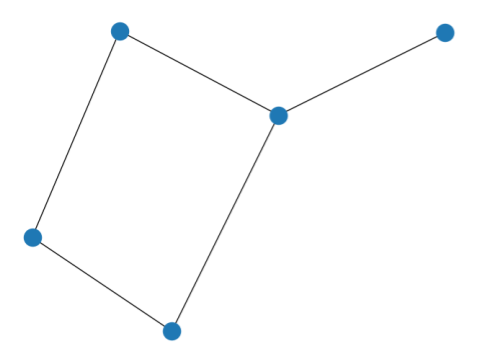
nx.draw(g)
plt.savefig("filename.png")
|
Output:
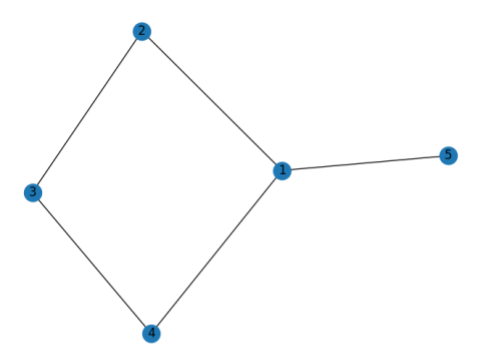
To add numbering in the node add one argument with_labels=True in draw() function.
Python3
import networkx as nx
import matplotlib.pyplot as plt
g = nx.Graph()
g.add_edge(1, 2)
g.add_edge(2, 3)
g.add_edge(3, 4)
g.add_edge(1, 4)
g.add_edge(1, 5)
nx.draw(g, with_labels = True)
plt.savefig("filename.png")
|
Output:
Different graph types and plotting can be done using networkx drawing and matplotlib.
Note** : Here keywords is referred to optional keywords that we can mention use to format the graph plotting. Some of the general graph layouts are :
- draw_circular(G, keywords) : This gives circular layout of the graph G.
- draw_planar(G, keywords) :] This gives a planar layout of a planar networkx graph G.
- draw_random(G, keywords) : This gives a random layout of the graph G.
- draw_spectral(G, keywords) : This gives a spectral 2D layout of the graph G.
- draw_spring(G, keywords) : This gives a spring layout of the graph G.
- draw_shell(G, keywords) : This gives a shell layout of the graph G.
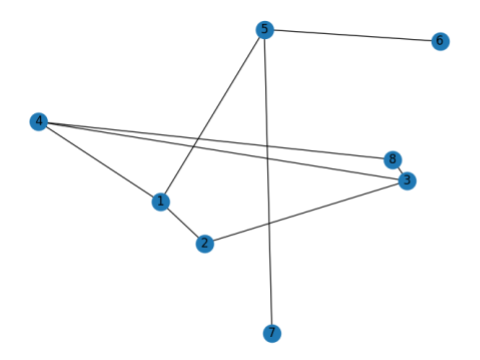
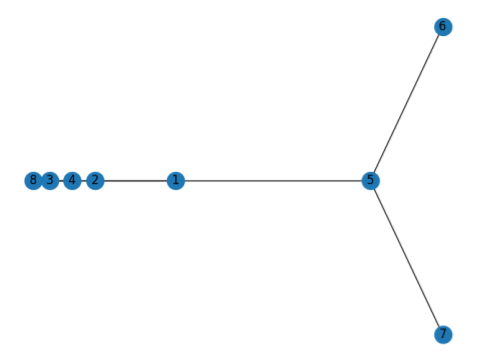
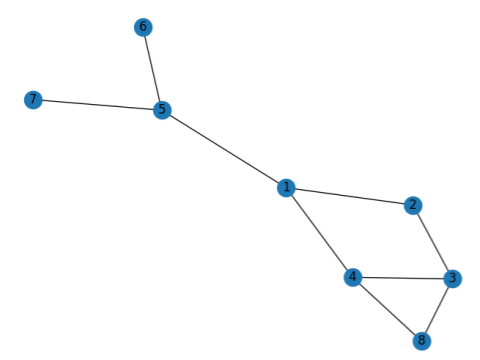
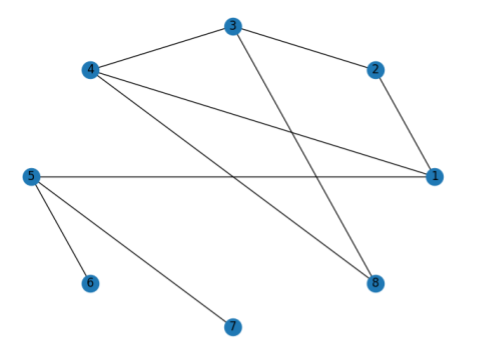
Example :
Python3
import networkx as nx
import matplotlib.pyplot as plt
g = nx.Graph()
g.add_edge(1, 2)
g.add_edge(2, 3)
g.add_edge(3, 4)
g.add_edge(1, 4)
g.add_edge(1, 5)
g.add_edge(5, 6)
g.add_edge(5, 7)
g.add_edge(4, 8)
g.add_edge(3, 8)
nx.draw_circular(g, with_labels = True)
plt.savefig("filename1.png")
plt.clf()
nx.draw_planar(g, with_labels = True)
plt.savefig("filename2.png")
plt.clf()
nx.draw_random(g, with_labels = True)
plt.savefig("filename3.png")
plt.clf()
nx.draw_spectral(g, with_labels = True)
plt.savefig("filename4.png")
plt.clf()
nx.draw_spring(g, with_labels = True)
plt.savefig("filename5.png")
plt.clf()
nx.draw_shell(g, with_labels = True)
plt.savefig("filename6.png")
plt.clf()
|
Outputs :
Circular Layout
Planar Layout
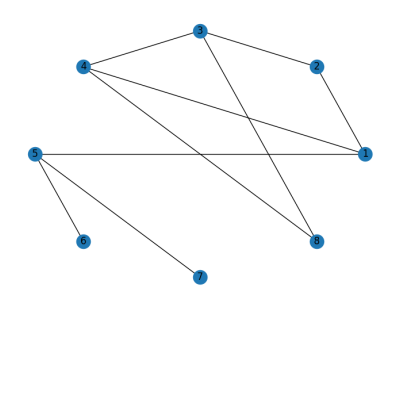
Random Layout
Spectral Layout
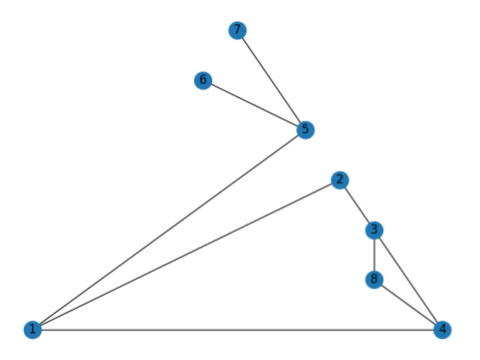
Spring Layout
Shell Layout
Reference : NetworkX Drawing Documentation
Like Article
Suggest improvement
Share your thoughts in the comments
Please Login to comment...