Unleashing the Power of Spring Eureka Server for Microservices
Last Updated :
27 Feb, 2024
Microservices architecture has revolutionized software development, enabling scalability and flexibility. One crucial aspect of this architecture is effective service discovery, and Spring Eureka Server stands out as a powerful tool for achieving this.
In this article, we will be learning the setting up, configuring, and utilizing Spring Eureka Server, offering detailed code snippets and explanations.
Understanding Microservices and Service Discovery
Microservices Overview:
- Definition and characteristics of microservices.
- Benefits such as scalability, agility, and fault isolation.
- Microservices communication patterns: synchronous and asynchronous.
Service Discovery Significance:
- Challenges in managing microservices without service discovery.
- The role of service discovery in enabling dynamic, scalable microservices.
Spring Eureka Server
Netflix OSS Project:
- Overview of Eureka Server as part of the Netflix Open-Source Software suite.
- Netflix’s contribution to microservices architecture.
- Netflix Eureka as a cloud-based, self-service service discovery tool.
Key Features:
- Service registration and discovery.
- Dynamic updates and load balancing.
- High availability and fault tolerance.
- Extensibility and integration with other Spring Cloud components.
Steps to Setting Up the Spring Eureka Server Project
Below are the steps to set up the Spring Eureka Server Project.
Step 1: Project Initialization
- Creating a new Spring Boot project with Eureka Server.
- Setting up a project structure conducive to microservices architecture.
Step 2: Maven Dependencies
<!-- Eureka Server Dependency -->
<dependency>
    <groupId>org.springframework.cloud</groupId>
    <artifactId>spring-cloud-starter-netflix-eureka-server</artifactId>
</dependency>
Step 3: Configuring Eureka Server
application.yml:
# Eureka Server Configuration
# yaml code

server:
  port: 8761

spring:
  application:
    name: eureka-server

eureka:
  client:
    register-with-eureka: false
    fetch-registry: false
Explanation of key properties:
- server.port: The port on which Eureka Server will run.
- spring.application.name: The logical name of the application.
- eureka.client.register-with-eureka: Set to false as the server doesn’t register itself.
- eureka.client.fetch-registry: Set to false as the server doesn’t fetch the registry.
- Advanced configurations for security and custom settings.
Eureka Server Configuration Class:
Java
@SpringBootApplication
@EnableEurekaServer
public class EurekaServerApplication {
public static void main(String[] args) {
SpringApplication.run(EurekaServerApplication.class, args);
}
}
|
Step 4: Starting the Eureka Server
Java
@SpringBootApplication
@EnableEurekaServer
public class EurekaServerApplication {
public static void main(String[] args) {
SpringApplication.run(EurekaServerApplication.class, args);
}
}
|
- Code snippet and command to launch the Eureka Server.
- Explanation of logs and initialization process.
- Profile-specific configuration for different environments.
Step 5: Registering Services with Eureka
Java
@SpringBootApplication
@EnableEurekaClient
public class MyMicroserviceApplication {
public static void main(String[] args) {
SpringApplication.run(MyMicroserviceApplication.class, args);
}
}
|
- Demonstration of configuring a microservice to register itself with the Eureka Server.
- Service instance metadata and custom configurations.
- Automatic registration of multiple instances.
Microservice Application Class:
Java
@SpringBootApplication
@EnableEurekaClient
public class MyMicroserviceApplication {
public static void main(String[] args) {
SpringApplication.run(MyMicroserviceApplication.class, args);
}
}
|
- Enable @EnableEurekaClient annotation.
- Customizing service registration with metadata.
REST Controller in Microservice:
Java
@RestController
public class MyController {
@GetMapping("/hello")
public String hello() {
return "Hello from MyMicroservice!";
}
}
|
Service Configuration Properties:
# Microservice Configuration
#yaml code
server:
  port: 7777

spring:
  application:
    name: hello-service

eureka:
  client:
    service-url:
      default-zone: http://localhost:8761/eureka/
Configuration file for the microservice, including port, application name, and Eureka server URL.
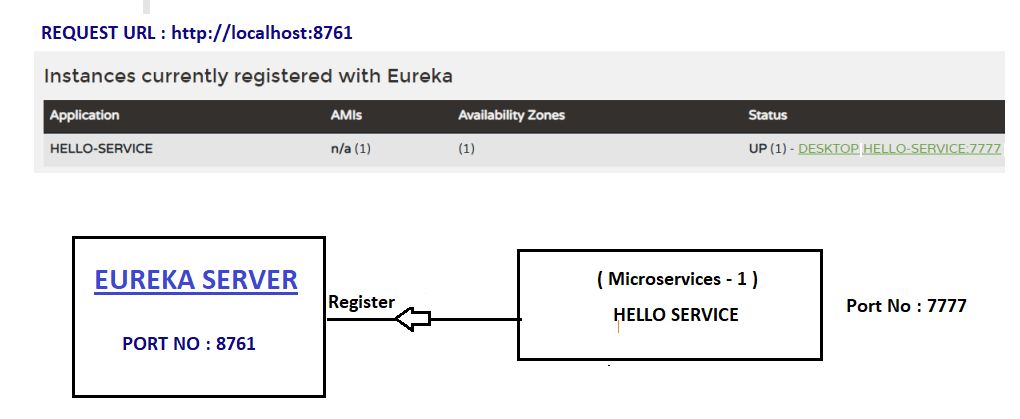
Dashboard screenshot of the Eureka server after hitting the URL
Step 6: Eureka Dashboard and Monitoring
URL and Credentials:
- The Eureka Server dashboard is accessible by default at http://localhost:8761/.
- No authentication is required by default, but security configurations can be applied if needed.
- Access credentials are usually not required for local development, but in production environments, securing the dashboard is recommended.
Real-time Monitoring:
- The dashboard provides real-time monitoring of registered services.
- It allows administrators and developers to visualize the current state of the microservices ecosystem.
Dashboard Information:
- Details Provided for Each Registered Service.
Service Name:
The logical name assigned to the microservice.
Instance Information:
- Hostname: The hostname or IP address of the machine where the service instance is running.
- Port: The port on which the service instance is listening for requests.
- Status: Indicates whether the service instance is UP, DOWN, or in an unknown state.
- Metadata: Custom metadata associated with the service instance (e.g., version, environment).
Customizing the Dashboard:
- Eureka Server allows for customization of the dashboard to include additional information.
- Custom metadata added during service registration can be displayed to provide more context.
- The dashboard can be extended with plugins for additional features and integrations.
Interpreting the Information for Effective Monitoring:
- Service Availability: Check the status of each service instance. Ensure they are in the ‘UP’ state for healthy services.
- Instance Details: Examine details such as hostname, port, and metadata to identify specific instances.
- Health Status: Monitor the overall health status to identify potential issues with the Eureka Server itself.
- Statistics Trends: Analyze statistics over time to identify patterns and potential bottlenecks.
- Custom Metadata: Leverage custom metadata for additional insights into the state and versioning of microservices.
Real-time Interaction:
- The dashboard updates in real-time as services register or deregister.
- Administrators can dynamically explore and analyze the state of the microservices ecosystem.
- Hover over instances or services to view additional details or actions.
By thoroughly exploring the Eureka Dashboard, users can gain actionable insights into the health and performance of their microservices architecture. The real-time monitoring capabilities empower administrators to make informed decisions and swiftly address any issues that may arise.
Step 7: High Availability and Clustering
Cluster Setup:
- Configuring a highly available Eureka Server cluster.
- Choosing the appropriate replication and synchronization strategy.
- Configuring heartbeat intervals for better responsiveness.
Production Considerations:
- JVM tuning and memory considerations for production deployment.
- Monitoring and alerting strategies.
- Integration with container orchestration platforms (Kubernetes).
Clustered Eureka Server Configuration:
# Eureka Server Cluster Configuration
# yaml code
server:
  port: 8761

spring:
  application:
    name: eureka-server

eureka:
  client:
    register-with-eureka: false
    fetch-registry: false
  server:
    enable-self-preservation: false
    eviction-interval-timer-in-ms: 60000
Step 8: Integrating Eureka with Other Spring Cloud Components
Feign for Declarative REST Clients:
- Simplifying REST API consumption with Feign.
- Declarative approach to defining and invoking services.
Feign Client Interface:
Creating a Feign client interface for the microservice.
Java
import org.springframework.cloud.openfeign.FeignClient;
import org.springframework.web.bind.annotation.GetMapping;
import org.springframework.web.bind.annotation.PathVariable;
@FeignClient(name = "hello-service")
public interface MyClient {
@GetMapping("/hello/{company}")
public String invokeMyHelloService(@PathVariable String company);
}
|
Controller class:
Java
@RestController
public class HiMyRestController {
@Autowired
private MyClient client;
@GetMapping("/hi/{name}")
public String messageDisplay(@PathVariable("name") String name) {
String message= "working";
return hieeMsg + " ---- " + name;
}
}
|
Main class of the consumer application using Feign.
Java
@SpringBootApplication
@EnableDiscoveryClient
@EnableFeignClients
public class EurekaFeignApplication {
public static void main(String[] args) {
SpringApplication.run(EurekaFeignApplication.class, args);
}
}
|
Configuration code:
# Microservice Configuration
#yaml code
server:
 port: 9999

spring:
 application:
 name: hi-service

eureka:
 client:
 service-url:
 default-zone: http://localhost:8761/eureka/
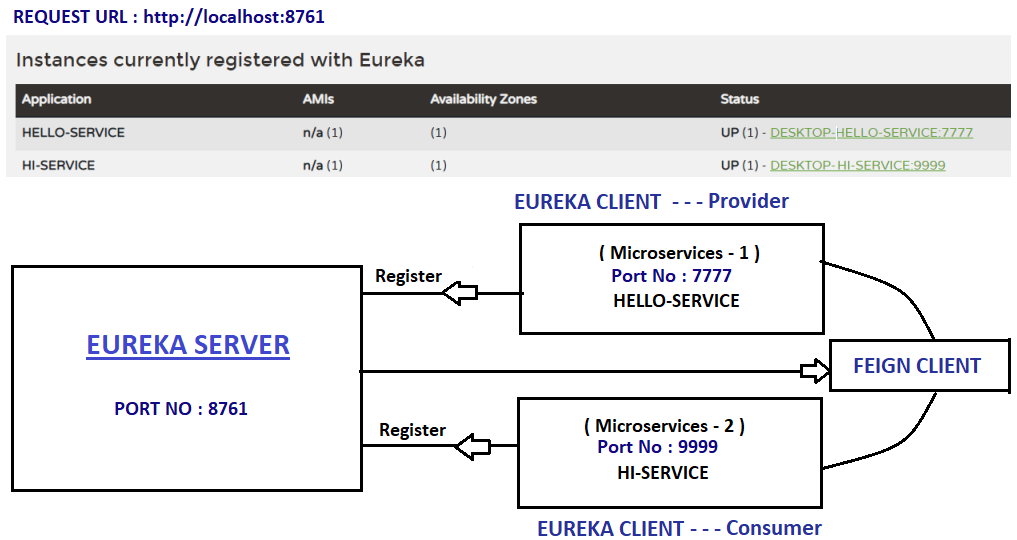
Below we can see the Eureka Server with Feign Client:
Troubleshooting and Best Practices
Common Issues:
- Identifying and resolving common Eureka-related issues.
- Debugging tips and strategies.
Best Practices:
- Recommendations for optimal configuration and maintenance of Eureka Server.
- Strategies for handling network partitions and transient failures.
- Logging and monitoring best practices.
Troubleshooting Section:
- Common issues such as connection problems, registration failures, and dashboard unavailability.
- Steps to troubleshoot and resolve each issue.
Best Practices:
- Regularly monitoring Eureka Server logs and dashboard for anomalies.
- Backing up and version-controlling the configuration files.
- Utilizing health checks and integrating Eureka with external monitoring tools.
Share your thoughts in the comments
Please Login to comment...