Semantic-UI Statistics Variations Colored Variant
Last Updated :
06 Feb, 2022
Semantic UI is a modern framework used in developing seamless designs for the website. It gives the user a lightweight experience with its components. It uses predefined CSS and jQuery to incorporate different frameworks.
Semantic UI has a Statistics component to magnify particular data for your website. Users can also choose a particular color for a specific statistic. Let us see this variation of statistics.
Semantic UI Statistics Variations Colored Variant is used to display different colors as per your usage. Every statistic can be shown in a unique color to depict its importance. A single or group of statistics showing relatable content can be displayed in different colors. We will create a UI to show the statistics colored variation.
Semantic-UI Statistics Variations Colored Variant Class:
- red: This class is used to set the color of the statistics into the red.
- orange: This class is used to set the color of the statistics into orange.
- yellow: This class is used to set the color of the statistics into yellow.
- olive: This class is used to set the color of the statistics into the olive.
- green: This class is used to set the color of the statistics into green.
- teal: This class is used to set the color of the statistics into teal.
- blue: This class is used to set the color of the statistics into blue.
- violet: This class is used to set the color of the statistics into violet.
- purple: This class is used to set the color of the statistics into red.
- pink: This class is used to set the color of the statistics into pink.
- brown: This class is used to set the color of the statistics into brown.
- grey: This class is used to set the color of the statistics into grey.
Syntax:
<div class="ui Colored-Variant-Class statistic">
...
</div>
Example: This example demonstrates statistics colored variation by putting color names along with the statistic class. You can see in the first row the three fundamental primary colors and in the next row the secondary colors. There are more colors you can use to design semantic UI statistics.
HTML
<!DOCTYPE html>
<html>
<head>
<link href=
rel="stylesheet" />
</head>
<body>
<div class="ui container">
<center>
<h1>GeeksforGeeks</h2>
<strong>Semantic-UI Statistics Variations Colored Variant</strong>
</center>
<div class="ui four statistics">
<div class="red statistic">
<div class="value">
1
</div>
<div class="label">
Red
</div>
</div>
<div class="orange statistic">
<div class="value">
2
</div>
<div class="label">
Orange
</div>
</div>
<div class="yellow statistic">
<div class="value">
3
</div>
<div class="label">
Yellow
</div>
</div>
<div class="olive statistic">
<div class="value">
4
</div>
<div class="label">
Olive
</div>
</div>
<div class="green statistic">
<div class="value">
5
</div>
<div class="label">
Green
</div>
</div>
<div class="teal statistic">
<div class="value">
6
</div>
<div class="label">
Teal
</div>
</div>
<div class="blue statistic">
<div class="value">
7
</div>
<div class="label">
Blue
</div>
</div>
<div class="violet statistic">
<div class="value">
8
</div>
<div class="label">
Violet
</div>
</div>
<div class="purple statistic">
<div class="value">
9
</div>
<div class="label">
Purple
</div>
</div>
<div class="pink statistic">
<div class="value">
10
</div>
<div class="label">
Pink
</div>
</div>
<div class="brown statistic">
<div class="value">
11
</div>
<div class="label">
Brown
</div>
</div>
<div class="grey statistic">
<div class="value">
12
</div>
<div class="label">
Grey
</div>
</div>
</div>
</div>
</body>
</html>
|
Output: You can see the statistics in different colors in the image below. You can design your data in any color you like and showcase it on your web page.
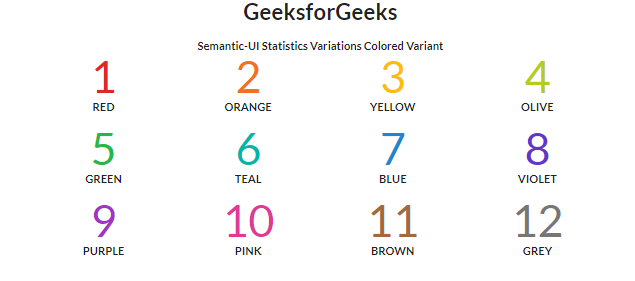
Semantic-UI Statistics Variations Colored Variant
Reference: https://semantic-ui.com/views/statistic.html#colored
Share your thoughts in the comments
Please Login to comment...