Python – seaborn.boxenplot() method
Last Updated :
18 Aug, 2020
Prerequisite : Fundamentals of Seaborn
Seaborn is a Python data visualization library based on matplotlib. It provides a high-level interface for drawing attractive and informative statistical graphics. There is just something extraordinary about a well-designed visualization. The colors stand out, the layers blend nicely together, the contours flow throughout, and the overall package not only has a nice aesthetic quality, but it provides meaningful insights to us as well.
seaborn.boxenplot()
Draw an enhanced box plot for larger datasets. This style of plot was originally named a “letter value” plot because it shows a large number of quantiles that are defined as “letter values”. It is similar to a box plot in plotting a nonparametric representation of a distribution in which all features correspond to actual observations. By plotting more quantiles, it provides more information about the shape of the distribution, particularly in the tails.
Syntax : seaborn.boxenplot(parameters)
Parameters :
- x, y, hue : Inputs for plotting long-form data.
- data : Dataset for plotting.
- order, hue_order : Order to plot the categorical levels in, otherwise the levels are inferred from the data objects.
- orient : Orientation of the plot (vertical or horizontal).
- color : Color for all of the elements, or seed for a gradient palette.
- palette : Colors to use for the different levels of the hue variable.
- saturation : Proportion of the original saturation to draw colors at.
- width : Width of a full element when not using hue nesting, or width of all the elements for one level of the major grouping variable.
- dodge : When hue nesting is used, whether elements should be shifted along the categorical axis.
- k_depth : The number of boxes, and by extension number of percentiles, to draw.
- linewidth : Width of the gray lines that frame the plot elements.
- scale : Method to use for the width of the letter value boxes.
- outlier_prop : Proportion of data believed to be outliers.
- showfliers : If False, suppress the plotting of outliers.
- ax : Axes object to draw the plot onto, otherwise uses the current Axes.
- kwargs : Other keyword arguments
Returns : Returns the Axes object with the plot drawn onto it.
Below is the implementation of above method with some examples :
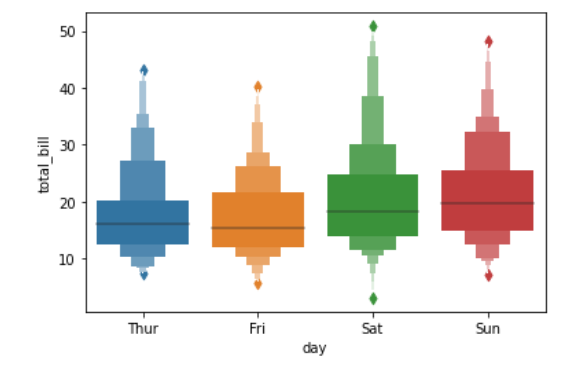
Example 1:
import seaborn as sns
import matplotlib.pyplot as plt
data = sns.load_dataset("tips")
sns.boxenplot(x = "day", y = "total_bill",
data = data)
plt.show()
|
Output :
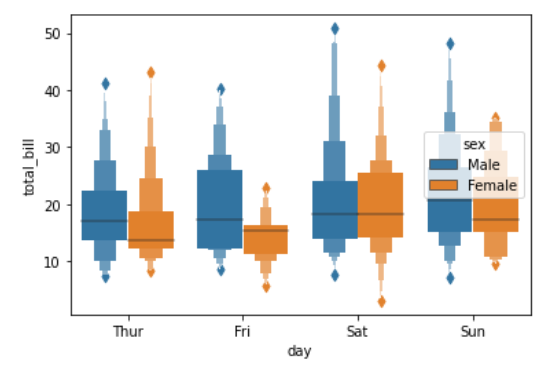
Example 2:
import seaborn as sns
import matplotlib.pyplot as plt
data = sns.load_dataset("tips")
sns.boxenplot(x ="day", y = "total_bill", hue = "sex",
data = data, width = 0.8)
plt.show()
|
Output :
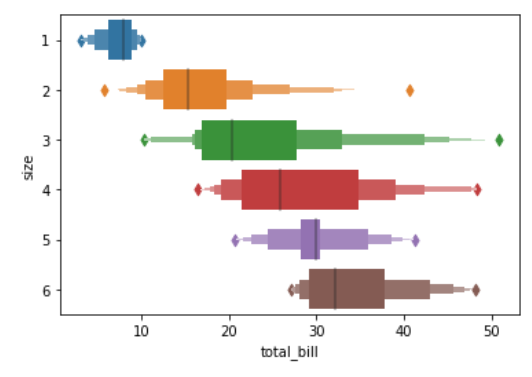
Example 3:
import seaborn as sns
import matplotlib.pyplot as plt
data = sns.load_dataset("tips")
sns.boxenplot(x = "total_bill", y = "size",
data = data, orient ="h")
plt.show()
|
Output :
Share your thoughts in the comments
Please Login to comment...