Python | Pandas.pivot_table()
Last Updated :
28 Sep, 2018
pandas.pivot_table(data, values=None, index=None, columns=None, aggfunc=’mean’, fill_value=None, margins=False, dropna=True, margins_name=’All’) create a spreadsheet-style pivot table as a DataFrame.
Levels in the pivot table will be stored in MultiIndex objects (hierarchical indexes) on the index and columns of the result DataFrame.
Parameters:
data : DataFrame
values : column to aggregate, optional
index: column, Grouper, array, or list of the previous
columns: column, Grouper, array, or list of the previous
aggfunc: function, list of functions, dict, default numpy.mean
-> If list of functions passed, the resulting pivot table will have hierarchical columns whose top level are the function names.
-> If dict is passed, the key is column to aggregate and value is function or list of functions
fill_value[scalar, default None] : Value to replace missing values with
margins[boolean, default False] : Add all row / columns (e.g. for subtotal / grand totals)
dropna[boolean, default True] : Do not include columns whose entries are all NaN
margins_name[string, default ‘All’] : Name of the row / column that will contain the totals when margins is True.
Returns: DataFrame
Code:
import pandas as pd
import numpy as np
df = pd.DataFrame({'A': ['John', 'Boby', 'Mina', 'Peter', 'Nicky'],
'B': ['Masters', 'Graduate', 'Graduate', 'Masters', 'Graduate'],
'C': [27, 23, 21, 23, 24]})
df
|
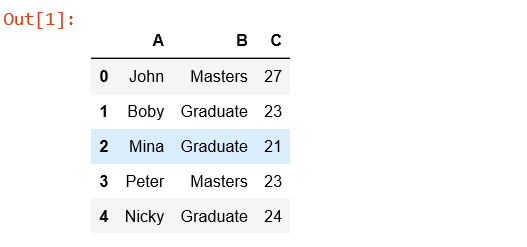
table = pd.pivot_table(df, index =['A', 'B'])
table
|
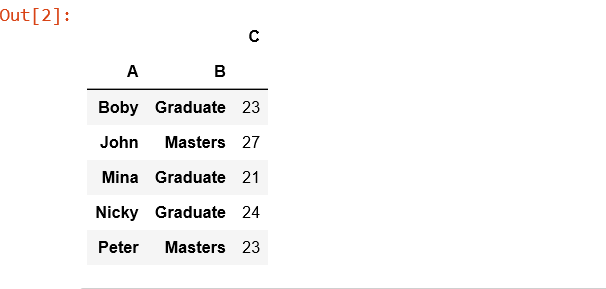
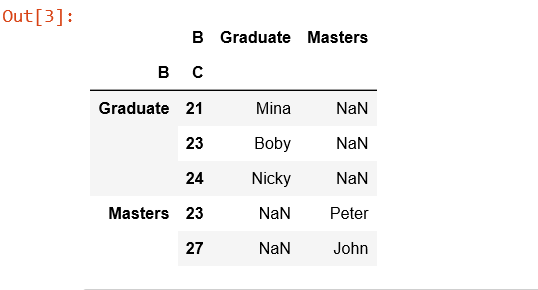
table = pd.pivot_table(df, values ='A', index =['B', 'C'],
columns =['B'], aggfunc = np.sum)
table
|
Share your thoughts in the comments
Please Login to comment...