PySpark Row using on DataFrame and RDD
Last Updated :
16 Oct, 2023
You can access the rows in the data frame like this: Attribute, dictionary value. Row allows you to create row objects using named arguments. A named argument cannot be omitted to indicate that the value is “none” or does not exist. In this case, you should explicitly set this to None.
Subsequent changes in version 3.0.0: Rows created from named arguments are now sorted by the position entered instead of alphabetically by field name. A row in PySpark is an immutable, dynamically typed object containing a set of key-value pairs, where the keys correspond to the names of the columns in the DataFrame.
Rows can be created in a number of ways, including directly instantiating a Row object with a range of values, or converting an RDD of tuples to a DataFrame. In pyspark, DataFrames are based on RDDs but provide a more structured and streamlined way to manipulate data using SQL-like queries and transformations. In this context, a Row object represents a record in a DataFrame or an element in an RDD of tuples.
1. Creating a Row object in PySpark
Approach:
- Import Row from pyspark.sql
- Create a row using Row()
- Access the columns in data using Attribute value.
Python3
from pyspark.sql import Row

# Create a Row object with three columns: name, age, and city
row = Row(name='GeeksForGeeks', age=25, city='India')

# Access the values of the row using dot notation
print(row.name)
print(row.age)
print(row.city)
Output:

2. Create Dataframe by using Row in pyspark
You can also create a data frame by using rows to specify a schema, which is a set of column names and data types.
- Import StructType, StructField, StringType, Integer Type from pyspark.sql.types, SparkSession from pyspark.sql
- Create a SparkSesion, define the schema using StructType and StructField
- Create a list of row objects to create a dataframe
- Dispaly the contents of the dataframe using show().
Python3
from pyspark.sql.types import StructType, StructField, StringType, IntegerType
from pyspark.sql import SparkSession
# Creating sparksession
spark=SparkSession.builder.appName("Dataframe using Row example").getOrCreate()
# Define the schema for a DataFrame with three columns: name, age, and city
schema = StructType([
StructField('name', StringType(), nullable=False),
StructField('age', IntegerType(), nullable=False),
StructField('city', StringType(), nullable=False)
])
# Create a list of Row objects
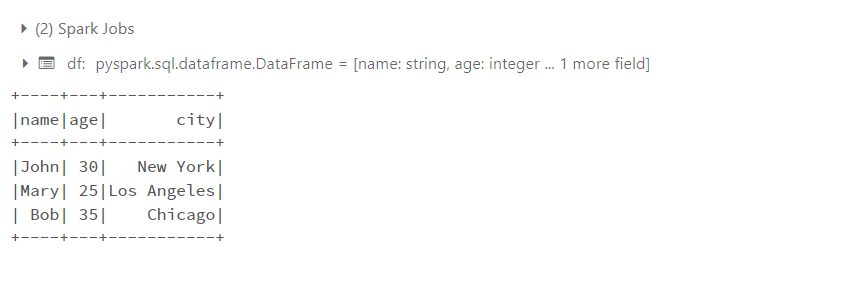
rows = [
Row(name='John', age=30, city='New York'),
Row(name='Mary', age=25, city='Los Angeles'),
Row(name='Bob', age=35, city='Chicago')
]
# Create a DataFrame from the rows and schema
df = spark.createDataFrame(rows, schema)
# Display the contents of the DataFrame
df.show()
Output:
 Example 2 : output from databricks
3. RDD operations on Row Dataframe in pyspark
Here we use the above dataframe as input. Rows can also be implemented and transformed in various ways using RDD operations such as map() and filter(). Below is an example of using an RDD of rows to calculate the average age of people in different cities.
- Convert the dataframe into RDD of rows.
- Filter the rows by city using filter(), which will filter the rows based on the condition provided.
- Then group the cities, find the average age: sum()/len().
- Print the results.
Python3
# Convert the DataFrame to an RDD of Rows
rdd = df.rdd

# Filter the rows by city
rdd_city = rdd.filter(lambda row: row.city == 'New York' or row.city == 'Chicago')

# Compute the average age for each city
rdd_avg_age = rdd_city.map(lambda row: (row.city, row.age)).groupByKey().mapValues(lambda ages: sum(ages) / len(ages))

# Display the results
print(rdd_avg_age.collect())
Output:
 Example 3: Output from databricks
4. Creating custom class from Row in pyspark
You could also create a Row-like class, such as Student, and use it like a Row object. Useful when creating real objects
Approach:
- Create a class with Row.
- Instantiate an object of your class with the desired value.
- Access an attribute of an object to get its value.
Python3
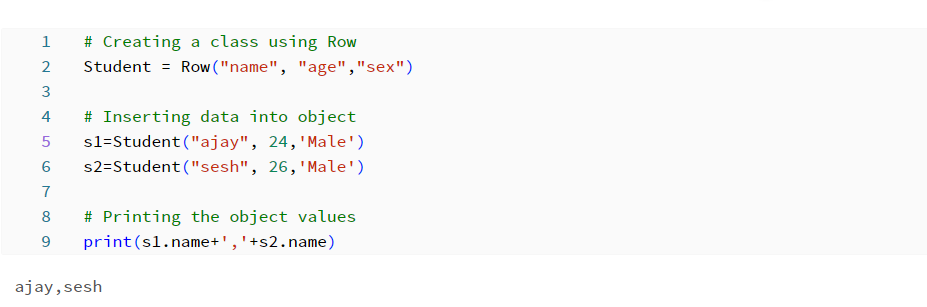
# Creating a class using Row
Student = Row("name", "age","sex")

# Inserting data into object
s1=Student("ajay", 24,'Male')
s2=Student("sesh", 26,'Male')

# Printing the object values
print(s1.name+','+s2.name)
Output:
 Example 4: Output from databricks
5. Example on RDD, Dataframe using Row in pyspark
Approach:
- Create a SparkSession object using SparkSession.builder.appName(“RowExample”).getOrCreate() .
- Define your data. In this case, data is a list of tuples representing employee information.
- Create a list of row objects from your data. This can be done using a list comprehension and the Row class as follows:rows = [rows for each row in the data (*rows)].
- Create a DataFrame header. This is a list of strings representing the names of the columns in the DataFrame.
- Create a DataFrame from the Row object and headers using the createDataFrame() method of the SparkSession object. The syntax is spark.createDataFrame(rows, header).
- Display the contents of the DataFrame using the show() method.
- Add new columns to the DataFrame using a list comprehension and the Row class. Here we add a “Bonus” column equal to 10% of salary. The syntax is new_rows = [Row(*row, row[4] * 0.1) for rows in rows] .
- Add a new header with the new column names. Create a new DataFrame using the createDataFrame() method.
- Display the contents of the new DataFrame using the show() method.
- Calculate the average age of male and female employees using the RDD and Row objects.
- Use the rdd attribute of the DataFrame object to convert it to an RDD.
- Extract the Gender and Age columns using the map() method of the RDD object.
- Aggregate the ages of male and female employees separately using the ReduceByKey() method.
- To count the number of male and female employees separately, use the map() method.
- Aggregate the number of male and female employees separately using the ReduceByKey() method.
- Join two RDDs using the join() method. Calculate the average age of male and female employees using the mapValues() method.
- Create a list of row objects containing gender and average age.
- Create a DataFrame from a list of Row objects using the createDataFrame() method.
- Use the show() method to display the average age of male and female employees.
Python3
# Example to demonstrate Rows using rdd and dataframe
from pyspark.sql import SparkSession, Row

# Create a SparkSession
spark = SparkSession.builder.appName("RowExample").getOrCreate()

# Create a data
data = [(1, "John", "M",32,45000), (2, "Jane", "M",35,65000), (3, "Bob", "M",30,60000), (4, "Alice", "M",20,25000),(5,"shreya","F",26,45000)]

# Create a list of Row objects from the data
rows = [Row(*line) for line in data]

header=["id","name","gender","age","salary"]

# Create a DataFrame from the rows and the header
df = spark.createDataFrame(rows, header)

# Display the contents of the DataFrame
df.show()

# Add a new column to the DataFrame using Row objects
new_rows = [Row(*row,row[4] * 0.1) for row in rows]

# Adding new header
new_header = header + ["bonus"]

# Creating new dataframe
new_df = spark.createDataFrame(new_rows, new_header)

# Display the contents of the new DataFrame
new_df.show()

# Compute the average age of male and female employees using RDDs and Row objects
gender_age_rdd = df.rdd.map(lambda row: (row.gender, int(row.age)))
gender_age_sum_rdd = gender_age_rdd.reduceByKey(lambda x, y: x + y)
gender_count_rdd = gender_age_rdd.map(lambda x: (x[0], 1)).reduceByKey(lambda x, y: x + y)
gender_avg_age_rdd = gender_age_sum_rdd.join(gender_count_rdd).mapValues(lambda x: x[0] / x[1])
gender_avg_age_rows = [Row(gender=gender, avg_age=avg_age) for gender, avg_age in gender_avg_age_rdd.collect()]
gender_avg_age_df = spark.createDataFrame(gender_avg_age_rows)

# Display the average age of male and female employees
gender_avg_age_df.show()