PyQtGraph – Getting Data of Bar Graph
Last Updated :
25 Sep, 2020
In this article we will see how we can get data of the bar graph in the PyQtGraph module. PyQtGraph is a graphics and user interface library for Python that provides functionality commonly required in designing and science applications. Its primary goals are to provide fast, interactive graphics for displaying data (plots, video, etc.) and second is to provide tools to aid in rapid application development (for example, property trees such as used in Qt Designer).A bar chart or bar graph is a chart or graph that presents categorical data with rectangular bars with heights or lengths proportional to the values that they represent. The bars can be plotted vertically or horizontally. A vertical bar chart is sometimes called a column chart. Bar graph uses two data from two list i.e for x-axis and for the height of the bars.
We can create a plot window and bar graph with the help of commands given below
# creating a pyqtgraph plot window
window = pg.plot()

# creating a bar graph of green color
bargraph = pg.BarGraphItem(x=x, height=y1, width=0.6, brush='g')
In order to do this we use getData method with the bar graph object
Syntax : bargraph.getData()
Argument : It takes no argument
Return : It returns tuple
Below is the implementation
from PyQt5.QtGui import * from PyQt5.QtCore import Qt
import pyqtgraph as pg
from pyqtgraph.Qt import QtCore, QtGui
import numpy as np
import time
window = pg.plot()
icon = QIcon("logo.png")
window.setWindowIcon(icon)
window.setGeometry(100, 100, 600, 500)
title = "GeeksforGeeks PyQtGraph"
window.setWindowTitle(title)
y1 = [5, 5, 7, 10, 3, 8, 9, 1, 6, 2]
x = [1, 2, 3, 4, 5, 6, 7, 8, 9, 10]
bargraph = pg.BarGraphItem(x = x, height = y1, width = 0.6, brush ='g')
window.addItem(bargraph)
value = bargraph.getData()
print("Data : " + str(value))
if __name__ == '__main__':
import sys
if (sys.flags.interactive != 1) or not hasattr(QtCore, 'PYQT_VERSION'):
QtGui.QApplication.instance().exec_()
|
Output :
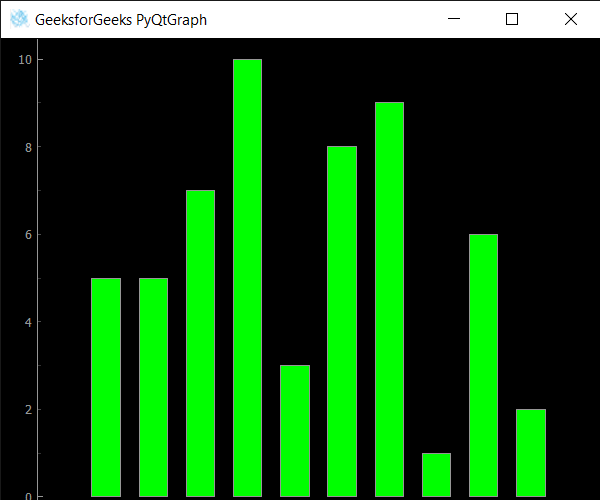
Data : ([1, 2, 3, 4, 5, 6, 7, 8, 9, 10], [5, 5, 7, 10, 3, 8, 9, 1, 6, 2])
Share your thoughts in the comments
Please Login to comment...