Plot line graph from NumPy array
Last Updated :
17 Dec, 2021
For plotting graphs in Python, we will use the Matplotlib library. Matplotlib is used along with NumPy data to plot any type of graph. From matplotlib we use the specific function i.e. pyplot(), which is used to plot two-dimensional data.
Different functions used are explained below:
- np.arange(start, end): This function returns equally spaced values from the interval [start, end).
- plt.title(): It is used to give a title to the graph. Title is passed as the parameter to this function.
- plt.xlabel(): It sets the label name at X-axis. Name of X-axis is passed as argument to this function.
- plt.ylabel(): It sets the label name at Y-axis. Name of Y-axis is passed as argument to this function.
- plt.plot(): It plots the values of parameters passed to it together.
- plt.show(): It shows all the graph to the console.
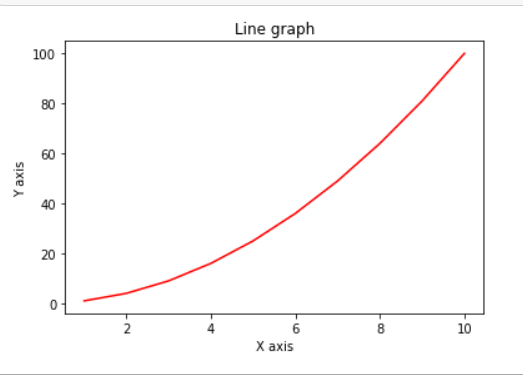
Example 1 :
Python3
import numpy as np
import matplotlib.pyplot as plt
x = np.arange(1, 11)
y = x * x
plt.title("Line graph")
plt.xlabel("X axis")
plt.ylabel("Y axis")
plt.plot(x, y, color ="red")
plt.show()
|
Output :

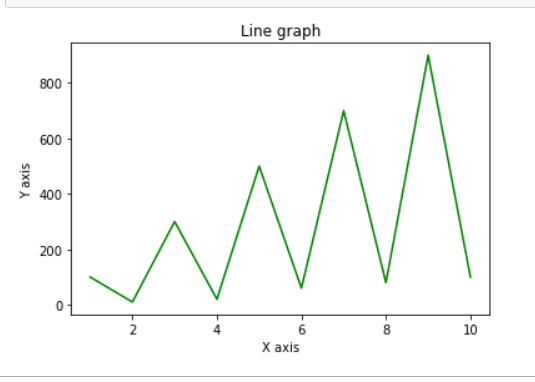
Example 2 :
Python3
import numpy as np
import matplotlib.pyplot as plt
x = np.arange(1, 11)
y = np.array([100, 10, 300, 20, 500, 60, 700, 80, 900, 100])
plt.title("Line graph")
plt.xlabel("X axis")
plt.ylabel("Y axis")
plt.plot(x, y, color ="green")
plt.show()
|
Output :

Share your thoughts in the comments
Please Login to comment...