numpy.geomspace() in Python
Last Updated :
31 May, 2021
numpy.geomspace() is used to return numbers spaced evenly on a log scale (a geometric progression).
This is similar to numpy.logspace() but with endpoints specified directly. Each output sample is a constant multiple of the previous.
Syntax : numpy.geomspace(start, stop, num=50, endpoint=True, dtype=None)
Parameters :
start : [scalar] The starting value of the sequence.
stop : [scalar] The final value of the sequence, unless endpoint is False. In that case, num + 1 values are spaced over the interval in log-space, of which all but the last (a sequence of length num) are returned.
num : [integer, optional] Number of samples to generate. Default is 50.
endpoint : [boolean, optional] If true, stop is the last sample. Otherwise, it is not included. Default is True.
dtype : [dtype] The type of the output array. If dtype is not given, infer the data type from the other input arguments.
Return :
samples : [ndarray] num samples, equally spaced on a log scale.
Code #1 : Working
Python
import numpy as geek
print("B\n", geek.geomspace(2.0, 3.0, num = 5), "\n")
point = geek.geomspace(1, 2, 10)
print("A\n", geek.sin(point))
|
Output :
B
 [ 2.          2.21336384  2.44948974  2.71080601  3.        ]

A
 [ 0.84147098  0.88198596  0.91939085  0.95206619  0.9780296   0.9948976
  0.99986214  0.98969411  0.96079161  0.90929743]
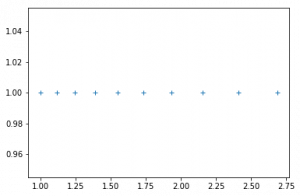
Code #2 : Graphical Representation of numpy.geomspace()
Python
import numpy as geek
import pylab as p
% matplotlib inline
x1 = geek.geomspace(1, 3, 10, endpoint = False)
y1 = geek.ones(10)
p.plot(x1, y1, '+')
|
Output :
Share your thoughts in the comments
Please Login to comment...