A numbers chart is a table that organizes numbers in sequential order. Typically, this sequence starts with 1-10 on the first row, continues with 11-20 on the next, 21-30 on the following, and so on.
Number charts are a beneficial resource for teaching math and learning counting for every young child. Even though teachers utilize these number charts for a variety of activities that help children visualize, learn, and read, they only show a predetermined range of numbers and the images that correspond to them.
In this article, we will learn what is a number chart in maths, and cover all subtopics of number chart in detail.
What is a Number Chart?
A number chart is a list of numbers that can be shown in a specific numerical order. Even so, we can say it is a graphical representation of numbers that benefits the visualization of numerical queries, patterns, and counts in pictures, with specific numerals in words within a sequence.
In simple words, number charts are useful in every academic curriculum and educational resource that can be used in teaching counting, number recognition, and other arithmetic calculations. Teachers also frequently focus on them and utilize them to support students in number recognition.
Types of Number Chart
Three types of number charts that can be evaluated are given below:
- Even Number Chart
- Odd Number Chart
- Prime Number Chart
Let’s discuss these charts in further detail.
1. Even Number Chart
The numbers that can be divided by two without leaving leftovers are shown on an even numbers chart. Therefore, the numbers are listed in ascending order, starting at 2 and moving up to a specified upper limit.
For example: 2, 4, 6, 8, 10, 12, 14, 16, 18, 20, 22, etc.

Read More about Even Numbers.
2. Odd Number Chart
The numbers that cannot be divided by two equally, leaving 1 as a remainder, are displayed on an odd numbers chart that lists odd numbers in succession. Therefore, it starts from 1 and goes up to a specific endpoint.
For example: 1, 3, 5, 7, 9, 11, 13, 15, 17, 19, 21, 23,… so on.
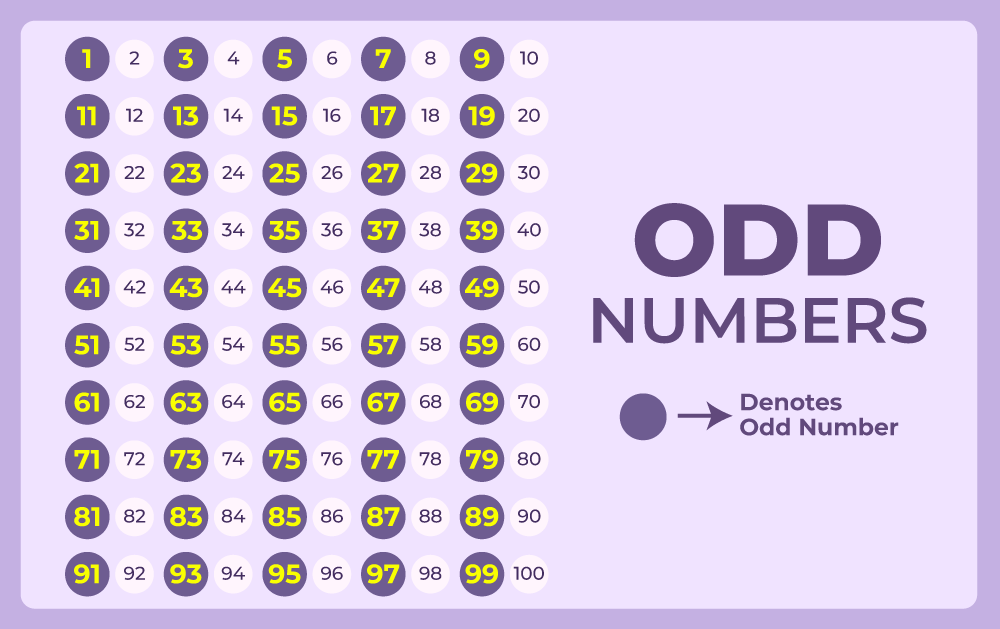
Odd Numbers represented in Number Chart
Read More about Odd Numbers.
3. Prime Number Chart
The numbers that have only two factors, 1 and the number itself, are shown on a prime numbers chart. Therefore, prime numbers are listed in ascending order, with the smallest prime number that begins with 2 at the top and up to a maximum number, where possible.
For example: 2, 3, 5, 7, 11, 13, 17, 19, 23, 29, etc.
.webp)
Prime Numbers represented in Number Chart
Read More about Prime Numbers.
How to Make a Number Chart
A few easy procedures can be used to construct a number chart. Let’s use the following steps to make a number chart from 1 to 100 that are given below:
- Firstly, draw a table of 10 rows × 10 columns.
- Next, start writing the numbers 1 through 10 in the first block, then continue writing the remaining numbers horizontally after that. On a number chart, the number after one is obtained by adding each one to the number before it in the form of a successor.
- Even better, write the numbers correctly and read them loudly. So, that we can get the numbers are in increasing order in this chart.
Number Chart in Words
In order to make it easier to grasp how to read the numbers, we may also write the numbers in words. So now let’s see the numbers from 1 to 20, along with the number words.
- 1: One
- 2: Two
- 3: Three
- 4: Four
- 5: Five
- 6: Six
- 7: Seven
- 8: Eight
- 9: Nine
- 10: Ten
- 11: Eleven
- 12: Twelve
- 13: Thirteen
- 14: Fourteen
- 15: Fifteen
- 16: Sixteen
- 17: Seventeen
- 18: Eighteen
- 19: Nineteen
- 20: Twenty
Number Chart Patterns
Number charts display a variety of patterns, such as even and odd numbers, counting in multiples of three, numbering in multiples of ten, and so forth. So, let’s see the number chart representing skip counting by underlining the 3’s pattern.
|
1
|
2
|
3
|
4
|
5
|
6
|
7
|
8
|
9
|
10
|
|
11
|
12
|
13
|
14
|
15
|
16
|
17
|
18
|
19
|
20
|
| 21 |
22
|
23
|
24
|
25
|
26
|
27
|
28
|
29
|
30
|
|
31
|
32
|
33
|
34
|
35
|
36
|
37
|
38
|
39
|
40
|
|
41
|
42
|
43
|
44
|
45
|
46
|
47
|
48
|
49
|
50
|
|
51
|
52
|
53
|
54
|
55
|
56
|
57
|
58
|
59
|
60
|
|
61
|
62
|
63
|
64
|
65
|
66
|
67
|
68
|
69
|
70
|
|
71
|
72
|
73
|
74
|
75
|
76
|
77
|
78
|
79
|
80
|
|
81
|
82
|
83
|
84
|
85
|
86
|
87
|
88
|
89
|
90
|
|
91
|
92
|
93
|
94
|
95
|
96
|
97
|
98
|
99
|
100
|
Number Chart – Important Points
Some of the important facts about number charts are as follows:
- It’s one of the teaching aids for mathematics.
- There are several varieties of them, including multiplication tables, hundred charts, and number lines.
- It gives numerical series and patterns in visual representations.
- It is utilized for counting, skip counting, and prime number identification tasks.
- It is suitable for all students to develop skills.
- It possesses practical applications in domains like engineering and finance.
People Also Read:
Solved Examples on Number Chart
Example 1: Find all the factors of 24. By using a number chart of 1 to 30.
Solution:
All the factors of 24 between 1 and 30 are 1, 2, 3, 4, 6, 8, 12, and 24.
|
1
|
2
|
3
|
4
|
5
|
6
|
7
|
8
|
9
|
10
|
|
11
|
12
|
13
|
14
|
15
|
16
|
17
|
18
|
19
|
20
|
| 21 |
22
|
23
|
24
|
25
|
26
|
27
|
28
|
29
|
30
|
Example 2: Identify all the prime numbers between 1 and 30. By using the number chart.
Solution:
All the prime numbers between 1 and 30 are 2, 3, 5, 7, 11, 13, 17, 19, 23, and 29.
|
1
|
2
|
3
|
4
|
5
|
6
|
7
|
8
|
9
|
10
|
|
11
|
12
|
13
|
14
|
15
|
16
|
17
|
18
|
19
|
20
|
| 21 |
22
|
23
|
24
|
25
|
26
|
27
|
28
|
29
|
30
|
Example 3: Identify all the odd numbers between 1 and 40. By using the number chart.
Solution:
All the odd numbers between 1 and 40 are 1, 3, 5, 7, 9, 11, 13, 15, 19, 21, 23, 25, 27, 29, 31, 33, 35, 37, and 39.
|
1
|
2
|
3
|
4
|
5
|
6
|
7
|
8
|
9
|
10
|
|
11
|
12
|
13
|
14
|
15
|
16
|
17
|
18
|
19
|
20
|
| 21 |
22
|
23
|
24
|
25
|
26
|
27
|
28
|
29
|
30
|
|
31
|
32
|
33
|
34
|
35
|
36
|
37
|
38
|
39
|
40
|
Practice Problems on Number Chart
Problem 1: Find all the factors of 60. (Make use of the number chart to display it.)
Problem 2: Use a hundred chart to identify all the factors of 48.
Problem 3: Circle all the prime numbers from 1 to 50. By using the number chart.
Problem 4: Go from 0 to 70 on a number line and skip counting by 7s. Which seven numbers do you land on?
FAQs on Number Chart
What is a Number Chart ?
A table listing the numbers in numerical order is called a number chart. In the first row horizontally, the sequence will be 1–10, in the second 11–20, and so forth until 100. Different types of specific number charts are possible for even numbers, odd numbers, etc.
How do I use a Number Chart ?
Using a number chart, you can scan vertically or horizontally to find the required number or pattern that is used to determine multiples, factors, counts, and numerical patterns.
What is a Hundred Chart?
A hundred chart is a number chart from 1 to 100. Therefore, it’s a grid of numbers with 1 through 100 listed in numerical order.
What are some real-life Applications of Number Chart ?
Organizing data, planning tasks, identifying patterns, and comprehending numerical relationships are just a few of the real-world applications for number charts.
Share your thoughts in the comments
Please Login to comment...