Matplotlib.artist.Artist.set_rasterized() in Python
Last Updated :
10 May, 2020
Matplotlib is a library in Python and it is numerical – mathematical extension for NumPy library. The Artist class contains Abstract base class for objects that render into a FigureCanvas. All visible elements in a figure are subclasses of Artist.
matplotlib.artist.Artist.set_rasterized() method
The set_rasterized() method in artist module of matplotlib library is used to force rasterized (bitmap) drawing in vector backend output.
Syntax: Artist.set_rasterized(self, rasterized)
Parameters: This method accepts the following parameters.
- rasterized: This parameter is the boolean value.
Returns: This method does not return any value.
Below examples illustrate the matplotlib.artist.Artist.set_rasterized() function in matplotlib:
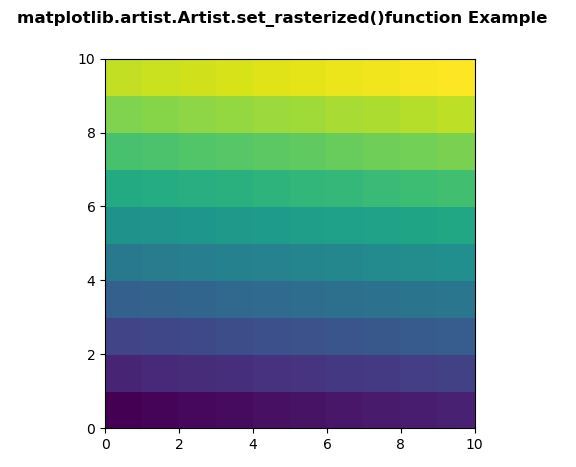
Example 1:
from matplotlib.artist import Artist
import numpy as np
import matplotlib.pyplot as plt
d = np.arange(100).reshape(10, 10)
xx, yy = np.meshgrid(np.arange(11), np.arange(11))
fig, ax = plt.subplots()
ax.set_aspect(1)
m = ax.pcolormesh(xx, yy, d)
Artist.set_rasterized(m, True)
fig.suptitle('matplotlib.artist.Artist.set_rasterized()\
function Example', fontweight ="bold")
plt.show()
|
Output:
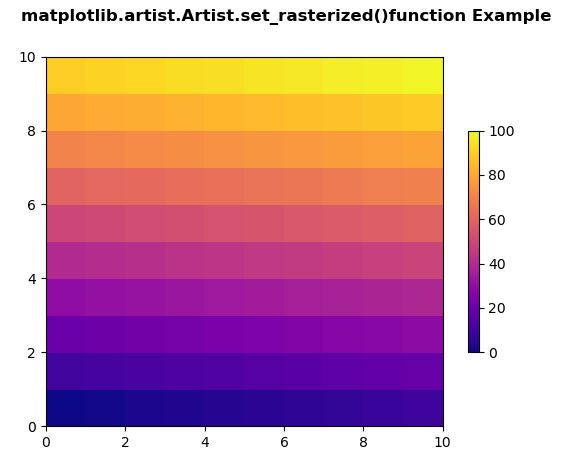
Example 2:
from matplotlib.artist import Artist
import matplotlib.pyplot as plt
import matplotlib.colors as mcolors
import matplotlib.gridspec as gridspec
import numpy as np
arr = np.arange(100).reshape((10, 10))
norm = mcolors.Normalize(vmin = 0., vmax = 100.)
pc_kwargs = {'cmap': 'plasma', 'norm': norm}
fig, ax = plt.subplots( )
im = ax.pcolormesh(arr, **pc_kwargs)
fig.colorbar(im, ax = ax, shrink = 0.6)
Artist.set_rasterized(im, False)
fig.suptitle('matplotlib.artist.Artist.set_rasterized()\
function Example', fontweight ="bold")
plt.show()
|
Output:
Share your thoughts in the comments
Please Login to comment...