Maps have become an integral part of our everyday lives. From driving to a location to finding some restaurants or stores nearby or while planning travel, almost every type of app uses maps. Using maps helps us to add location-based services in our application.
One way to add maps in a web application is using Leaflet JS. Leaflet JS is an open-source JavaScript library for adding simple and interactive web maps. It can add the map data to the map layers and has features like panning, zooming, etc that most of the applications require. Though leaflet provides some core features required in any map application, an easy way to increase the functionality of maps is using third-party plugins. As leaflet is an open-source library i.e. its source code is available on GitHub, there have been a lot of contributions and there are a lot of plugins available. You can get the list of the plugins here.
So, Leaflet is a map API and it helps us to interact with the map data but it is not providing any data. Nor does it provide the map itself as it is not a mapping service. So how do we get the map? The answer is that Leaflet depends on third parties to provide the basemap i.e Leaflet is built in such a way that it can be used with multiple base map layers. Generally, Leaflet is used with OpenStreetMaps but we can even use other map providers like Mapbox, Ersi, Bing Map Layers, etc. You can check different basemap providers here.
So, let us understand how leaflet can be used to interact with maps step-by-step:
1. The Directory Structure
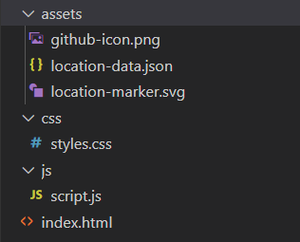
This is the directory structure that will be followed during this example. You can have a different directory structure as well but make sure it reflects in your code as well.
2. HTML Boilerplate and adding Leaflet References
HTML
<!DOCTYPE html>
<html>
<head>
<title> Playing Around With Leaflet JS </title>
<meta charset="UTF-8">
<meta name="viewport" content=
"width=device-width, initial-scale=1.0">
<link rel="stylesheet" href=
integrity=
"sha512-xodZBNTC5n17Xt2atTPuE1HxjVMSvLVW9ocqUKLsCC5CXdbqCmblAshOMAS6/keqq/sMZMZ19scR4PsZChSR7A=="
crossorigin="" />
integrity=
"sha512-XQoYMqMTK8LvdxXYG3nZ448hOEQiglfqkJs1NOQV44cWnUrBc8PkAOcXy20w0vlaXaVUearIOBhiXZ5V3ynxwA=="
crossorigin=""></script>
</head>
<body></body>
</html>
|
To add map to our web page, simple web technologies like HTML, CSS and JavaScript are required. To use Leaflet in your code, you need to add the Leaflet CSS and Leaflet JS. You can either download them or use them by including their CDNs (see above code sample).
3. Create a Map container and create a Map object
<div id="mymap"> </div>
We first define a container element where we want to load the map and provide it an id “mymap”.
let map = L.map('mymap').setView([19.5937, 78.9629], 5);
Now, we create a map object using which we’ll create a map and manipulate it. We instantiate the map object with the id of the container element created above i.e. “mymap”. The setview method is used to set the center of the map and the zoom level.
4. Add Map Tiles using TileLayer
Javascript
L.tileLayer('https://{s}.tile.openstreetmap.org/{z}/{x}/{y}.png', { attribution: '© OpenStreetMap contributors',
maxZoom: 20,
minZoom: 2,
tileSize: 512,
zoomOffset: -1
}).addTo(map);
|
To load and display our map, we use TileLayer class to create a layer and specify the URL of the map tiles. The map is divided into multiple tiles and we are using OpenStreetMap for displaying the map tiles. You can get the list of tile providers here. We do specify some additional parameters like min zoom level, max zoom level, tile size. As we are using the map tiles of OpenStreetMap, we need to provide proper attribution (or credits) to OpenStreetMap (or whichever map tile provider you are using) for using their map tiles. To add this layer on our map, we use the addTo() method.
5. Making our dataset for including markers
https://github.com/OptimalLearner/Leaflet-JS-Example-Code/blob/master/assets/location-data.json
Now, we need to add some markers to the map which point to some location. We have saved the data in a different file named “location-data.json”. This file contains the marker details like latitude and longitude coordinates, etc. You can access the data from the above link provided and save it along with your code. If you want to keep the data in your JS file itself, you can create a variable and assign it to the above data.
6. Creating marker, binding popups and event handling
Javascript
let marker = L.marker([latitude, longitude]).bindPopup(`<h3> ${title} </h3>
<p> ${description} </p>
`).on('click', () => {
map.flyTo([latitude, longitude], zoomLevel);
}).addTo(map);
|
A marker is used to identify and highlight a location on a map. To add a marker in Leaflet, we initialize the marker class and pass the coordinates of the location we need the marker to point to. You may add as many markers as you want. Now to identify which location is marked by the marker, we can add a popup to the marker which will tell us the location information. We add a popup using bindPopup method to display the location name and a little description of the location.
Leaflet also has the ability to react to events generated by us. We can add an event listener using “on” function for a particular event (in our case “click”) which listens to a function containing some set of operations. At the end, we add this marker to our map.
7. Customizing the marker icon
Javascript
let iconOption = {
iconUrl: './assets/location-marker.svg',
iconSize: [30, 30]
};
let ourCustomIcon = L.icon(iconOption);
let marker = L.marker([latitude, longitude],
{icon: ourCustomIcon}).bindPopup(`<h3> ${title} </h3>
<p> ${description} </p>
`).on('click', () => {
map.flyTo([latitude, longitude], zoomLevel);
}).addTo(map);
|
Not everyone would like to use the same default marker icon. So, here comes the feature of custom marker icons to the rescue. You need to use the Icon class and pass the URL of the icon which you want to use as the marker and add the size of icon [width, height] in pixels(px). Now we need to add the icon to the marker. In the Marker class after adding the coordinates, we can pass the custom marker icon for rendering the marker.
8. What’s best for you: flyTo or setView?
Javascript
map.setView([latitude, longitude], zoomLevel);
map.flyTo([latitude, longitude], zoomLevel);
|
Both are doing the same work of changing the location to specific coordinates but flyTo() method provides some animation that will fly to the location specified using coordinates. If you need some animation then you can use flyTo() method else setView() also works to change the location.
There is another method called panTo([latitude, longitude]) which is just calling setView() keeping the zoom level to current map’s zoom level. setView() method allows you to even set the zoom level but that’s not the case with panTo().
9. Complete Code and Result
HTML
<!DOCTYPE html>
<html>
<head>
<title> Playing Around With LeafletJS </title>
<meta charset="UTF-8">
<meta name="viewport" content=
"width=device-width, initial-scale=1.0">
<link rel="stylesheet" href=
integrity=
"sha512-xodZBNTC5n17Xt2atTPuE1HxjVMSvLVW9ocqUKLsCC5CXdbqCmblAshOMAS6/keqq/sMZMZ19scR4PsZChSR7A=="
crossorigin="" />
integrity=
"sha512-XQoYMqMTK8LvdxXYG3nZ448hOEQiglfqkJs1NOQV44cWnUrBc8PkAOcXy20w0vlaXaVUearIOBhiXZ5V3ynxwA=="
crossorigin=""></script>
<link rel="stylesheet" type="text/css" href="css/styles.css">
</head>
<body>
<h2 class="heading"> Some Indian Monuments </h2>
<div id="mymap"> </div>
<div class="button-group flex-style">
<div class="component1">
<button class="map-zoom-out-btn">Map Zoom Out</button>
</div>
<div class="component2">
<select class="select-dropdown" name="dropdown">
<option> Select any monument </option>
</select>
<button class="search-btn"> Search </button>
</div>
</div>
<footer class="footer flex-style"> Made Using Leaflet JS |
<a href=
target="_blank"> Source Code</a> <a href=""
target="_blank"> <img src="assets/github-icon.png" />
</a>
</footer>
<script type="text/javascript" src="js/script.js"></script>
</body>
</html>
|
CSS
body {
margin: 0;
padding: 0;
box-sizing: border-box;
font-family: sans-serif;
}
.heading {
font-family: monospace;
font-size: 40px;
text-align: center;
margin: 2.5vh 0;
}
#mymap {
width: 90vw;
height: 70vh;
margin: 0 5vw 2vh;
border: 3px solid #888;
}
.button-group {
justify-content: space-evenly !important;
}
.map-zoom-out-btn, .search-btn {
background-color: #0072B5;
color: #FFF;
padding: 10px 35px;
border: none;
font-size: 17px;
border-radius: 5px;
cursor: pointer;
}
.select-dropdown {
display: inline-block;
margin: 0 15px 0 0;
padding: 10px 35px;
border: 1px solid #AAA;
font: inherit;
-webkit-appearance: none;
-moz-appearance: none;
-ms-appearance: none;
appearance: none;
background: #FFF;
background-repeat: no-repeat;
background-image:
linear-gradient(45deg, transparent 50%, currentColor 50%),
linear-gradient(135deg, currentColor 50%, transparent 50%);
background-position: right 15px top 1em, right 10px top 1em;
background-size: 5px 5px, 5px 5px;
}
.footer {
position: fixed;
left: 0;
bottom: 0;
width: 100%;
display: flex;
justify-content: center;
align-items: center;
text-align: center;
font-size: 17px;
padding-bottom: 8px;
}
.footer a {
padding: 0 5px 0 5px;
color: #000;
cursor: pointer;
}
.flex-style {
display: flex;
justify-content: center;
align-items: center;
}
|
Javascript
let map = L.map("mymap").setView([19.5937, 78.9629], 5);
let ourData = [];
L.tileLayer("https://{s}.tile.openstreetmap.org/{z}/{x}/{y}.png", { attribution: "© OpenStreetMap contributors",
maxZoom: 20,
minZoom: 2,
tileSize: 512,
zoomOffset: -1,
}).addTo(map);
let iconOption = {
iconUrl: "./assets/location-marker.svg",
iconSize: [30, 30],
};
let ourCustomIcon = L.icon(iconOption);
fetch("./assets/location-data.json")
.then((response) => response.json())
.then((data) => {
ourData = data;
for (let i = 0; i < data.length; i++) {
let option = document.createElement("option");
option.value = i + 1;
option.text = data[i].title;
document.querySelector(".select-dropdown").appendChild(option);
let marker = L.marker([data[i].latitude, data[i].longitude], {
icon: ourCustomIcon,
})
.bindPopup(
`<h3> ${data[i].title} </h3>
<p> ${data[i].description} </p>
`
)
.on("click", () => {
map.flyTo([data[i].latitude, data[i].longitude], data[i].zoomLevel);
})
.addTo(map);
}
})
.catch((error) => alert(error));
document.querySelector(".map-zoom-out-btn").addEventListener("click", () => {
map.flyTo([19.5937, 78.9629], 5);
});
document.querySelector(".search-btn").addEventListener("click", () => {
let select = document.querySelector(".select-dropdown");
let value = select.options[select.selectedIndex].value;
map.flyTo(
[ourData[value - 1].latitude, ourData[value - 1].longitude],
ourData[value - 1].zoomLevel
);
});
|
Using the HTML Boilerplate, we have added a map container, a button for zooming out the map, and a dropdown that will contain the locations marked on the map. We have applied some styles to our components using external CSS by adding references to the external style sheet. In the script file, we create a map object and add map tiles to the object. Then we create our custom icon object and add the size and the URL of the icon to the icon options which we will add to the marker while creating the marker for each location.
Using Fetch API, we request our data by providing the URL of data. We get the response object which is then converted to json. Using this json data which contains the information about locations, we dynamically add the options for the locations to the dropdown list using DOM and we create markers for every location along with popups and onclick event listener. In case of any errors, the error message is alerted to the user.
We added an onclick event listener on the Zoom Out button which flies us to the initial coordinates and zoom level. We also added an event listener on the Search button which gets the value of the dropdown list and using the value we select the location and zoom the map to that selected location.
The result of the above example can be seen below:
To run your webpage locally, you need to run the webpage through local server. You can either use WAMP or XAMPP or simpleNode.js http-server. If you get stuck somewhere in between, you can refer this GitHub Repository.
Share your thoughts in the comments
Please Login to comment...