How to Resolve Object Not Found Error in R
Last Updated :
01 Mar, 2024
The “Object Not Found” error is a common stumbling block for many R Programming Language users, especially beginners. It occurs when R cannot locate the object we’re trying to reference in our code. While it can create issues, resolving this error is often straightforward with a few simple strategies.
What is an “Object Not Found” Error?
The “Object Not Found” error pops up when we try to use a variable, function, or dataset that R cannot find. It’s like looking for our keys in the wrong pocket—it’s there somewhere, but we just can’t find it.
Causes of the “Object Not Found” Error
1. Typing Mistake
Misspelling an object’s name is an issue. R is picky about spelling and won’t recognize a variable if it’s not spelled exactly right.
R
my_variable <- 10
print(my_variabll)
|
Output:
Error in h(simpleError(msg, call)) :
  error in evaluating the argument 'x' in selecting a method for function 'print': object 'my_variabll' not found
2. Scope Confusion
Sometimes, R gets confused about where to look for objects, especially in functions or packages. If we try to access something that’s not in the right place, R will throw an “Object Not Found” error.
R
my_function <- function() {
print(x)
}
my_function()
|
Output:
Error in print(x) : object 'x' not found
3. Data Missing
Forgetting to load the data before trying to use it is another common slip-up. R can’t work with data it hasn’t been introduced to yet.
Output:
Error in h(simpleError(msg, call)) :
  error in evaluating the argument 'x' in selecting a method for function 'print': object 'my_data' not found
4. Package Problems
If we forget to load a package that contains the function or dataset we’re trying to use, R won’t know where to find and it will give an error.
R
ggplot(data = iris, aes(x = Sepal.Length, y = Sepal.Width)) +
geom_point()
|
Output:
Error in ggplot(data = iris, aes(x = Sepal.Length, y = Sepal.Width)) :
  could not find function "ggplot"
Solutions to the “Object Not Found” Error
1. Check Object Names
Review code carefully to ensure that the names of the objects we’re referencing are spelled correctly and match the names of the objects in environment. Pay attention to capitalization, as R is case-sensitive.
R
my_var <- c(1, 2, 3)
print(my_var)
|
Output:
[1] 1 2 3
2.Inspect Scoping
Working within a function or another environment, double-check the scoping rules to ensure that the object we’re trying to access is available within that scope. Use ls() or objects() functions to list objects in our environment and confirm their availability.
R
my_function <- function() {
inner_var <- 42
return(inner_var)
}
result <- my_function()
print(result)
|
Output:
[1] 42
The function my_function now returns the value of inner_var using the return() statement.
- When we call my_function(), it returns the value of inner_var, which is then stored in the variable result.
- Finally, print the value stored in result, which should display 42.
3.Load Data
Working with data frames or other datasets, make sure that the data has been loaded into R session using functions like read.csv() or readRDS() before trying to access it.
R
dummy_data <- data.frame(
ID = 1:10,
Age = sample(18:60, 10, replace = TRUE),
Score = rnorm(10, mean = 75, sd = 10)
)
head(dummy_data)
|
Output:
  ID Age    Score
1  1  41 69.04521
2  2  51 89.98787
3  3  25 61.99795
4  4  26 62.42095
5  5  32 81.30165
6  6  54 87.05509
We create a dummy_data data frame with three columns: ID, Age, and Score.
- The ID column contains values from 1 to 10.
- The Age column contains random ages between 18 and 60.
- The Score column contains random scores generated from a normal distribution with a mean of 75 and a standard deviation of 10.
- We print dummy_data to view the generated data.
- Save the generated data to a CSV file named dummy_data.csv.
- Then load the data from the CSV file into R using read.csv().
- Finally, display the first few rows of the loaded data using head() to verify that it has been successfully loaded.
4.Load Required Packages
Using functions or objects from external packages, ensure that the necessary packages are loaded into the R session using library() or require(). We can use search() to check which packages are currently loaded.
R
library(ggplot2)
my_data <- data.frame(
x_var = 1:10,
y_var = rnorm(10)
)
ggplot(data = my_data, aes(x = x_var, y = y_var)) +
geom_point()
|
Output:
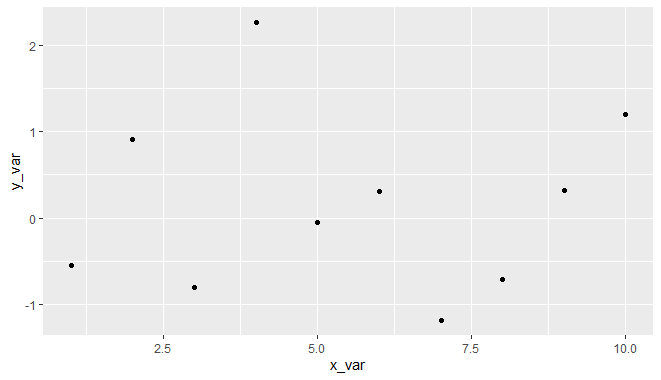
Resolve Object Not Found Error in R
We first load the ggplot2 package using the library() function, ensuring that it’s available for use.
- Then, we create a dummy dataset my_data containing two variables: x_var with values from 1 to 10, and y_var with random numbers generated from a standard normal distribution.
- We print the dummy dataset using print() to inspect its structure and values.
- Finally, we use ggplot() to create a scatter plot of the data, mapping x_var to the x-axis and y_var to the y-axis. The geom_point() function adds points to the plot, creating a scatter plot.
Conclusion
Encountering the “Object Not Found” error in R can be frustrating, but it’s usually straightforward to resolve once you understand its underlying causes. By carefully checking object names, inspecting scoping rules, ensuring data is loaded, and loading required packages, we can effectively resolve this error and continue with the data analysis or programming tasks in R.
Share your thoughts in the comments
Please Login to comment...