How to Pass Command Line Arguments to GDB in a Linux Environment?
Last Updated :
06 Dec, 2023
The GNU Debugger, commonly known as GDB, is a powerful tool used for debugging and analyzing programs in Linux and other Unix-like operating systems. While GDB is commonly used to debug programs, it can also be used to launch programs with specific command line arguments. This article will walk you through the process of passing command line arguments when starting GDB in a Linux environment.
Why Pass Command Line Arguments to GDB?
When debugging a program using GDB, you might encounter situations where you need to pass specific command line arguments to the program. These arguments could be essential for reproducing a specific bug or for testing the program with different input values. By passing command line arguments when starting GDB, you can set up your debugging environment with the desired initial conditions.
Passing command line arguments to GDB
Syntax:
# Compiling program with -g flag for debugging
g++ -g -o myprogram myprogram.cpp
# Running compiled program with gdb
gdb ./myprogram
# Passing CLI arguments
run arg1 arg2
Overview:
- Compile the C++ program with the -g flag for debugging: g++ -g -o myprogram myprogram.cpp
- Run GDB by specifying the compiled program as an argument: gdb ./myprogram
- Start the program within GDB using the run command, providing any desired command line arguments: run arg1 arg2.
- Set breakpoints within GDB to pause execution at specific locations in your program.
- Examine variables, step through code, and perform debugging operations in GDB to analyze your program’s behavior.
- Use GDB’s commands like next, step, print, and backtrace to navigate and troubleshoot your program’s execution.
- Once you’ve identified and fixed issues, continue program execution with the continue command.
- Exit GDB using the quit command when debugging is complete.
Steps to pass command line arguments to GDB
Step 1: Creating a program to debug
The provided code snippet is a C program named “example.c” designed to accept two command-line arguments, namely “arg1” and “arg2”, and then display these arguments. In case the required arguments are not provided, the program also offers a usage message.
C
#include <stdio.h>
int main(int argc, char *argv[]) {
if (argc != 3) {
printf("Usage: %s <arg1> <arg2>\n", argv[0]);
return 1;
}
printf("Argument 1: %s\n", argv[1]);
printf("Argument 2: %s\n", argv[2]);
return 0;
}
|
Step 2: Compiling the program with -g flag
Launch your terminal and type this command:
Command:
gcc -g -o example example.c
Explanation:
- gcc: This is the command for the GNU Compiler Collection, which is a widely used compiler for the C programming language.
- -g: The -g flag is an option used with the “gcc” command. It instructs the compiler to include debugging information in the compiled executable. This debugging information is essential for effective debugging using tools like GDB (GNU Debugger).
- -o example: This part of the command specifies the name of the output or executable file that will be generated. In this case, it’s “example.” The -o flag is used to indicate the output file name.
- example.c: This is the input file, which contains the C source code you want to compile.
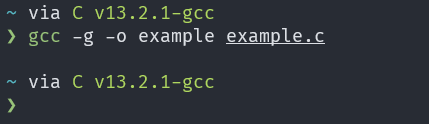
Output: gcc -g -o example example.c
Step 3: Start GDB with Command Line Arguments
Open the GNU Debugger (GDB) by entering the command gdb ./example in the terminal, here “example” is the compiled output file name.
Command:
gdb ./example
Explanation:
This command sets up GDB to debug the executable file named ‘example‘ located in the current directory. Once inside GDB, you can provide specific command line arguments to your program for testing and debugging purposes.
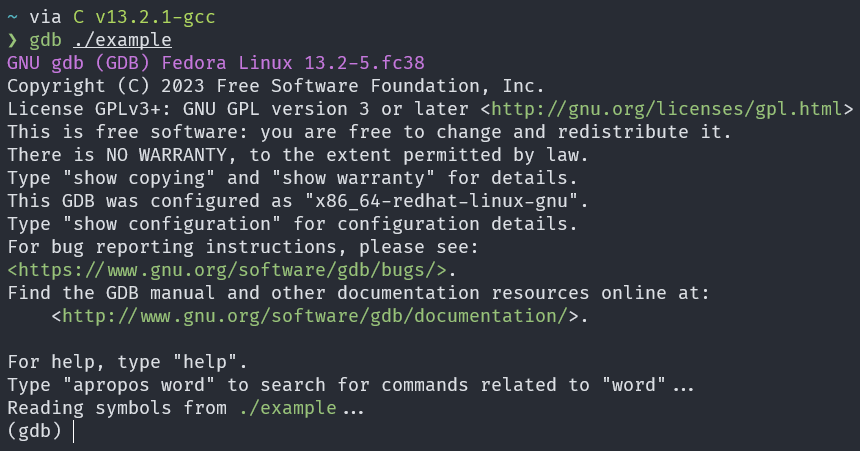
Output: gdb ./example
Step 4: Passing the arguments
Within the GDB environment, you can pass command line arguments to your program in the following manner. For the sake of explanation, let’s clarify that “Hello” is being designated as the first argument, and “World” is being designated as the second argument.
Command:
run Hello World
Explanation:
- run: This is a command within the GDB (GNU Debugger) environment. It is used to initiate the execution of the program being debugged.
- Hello: This is the first argument being passed to the program.
- World: This is the second argument being passed to the program.
Now, GDB will start the example program with the provided arguments “Hello” and “World“.
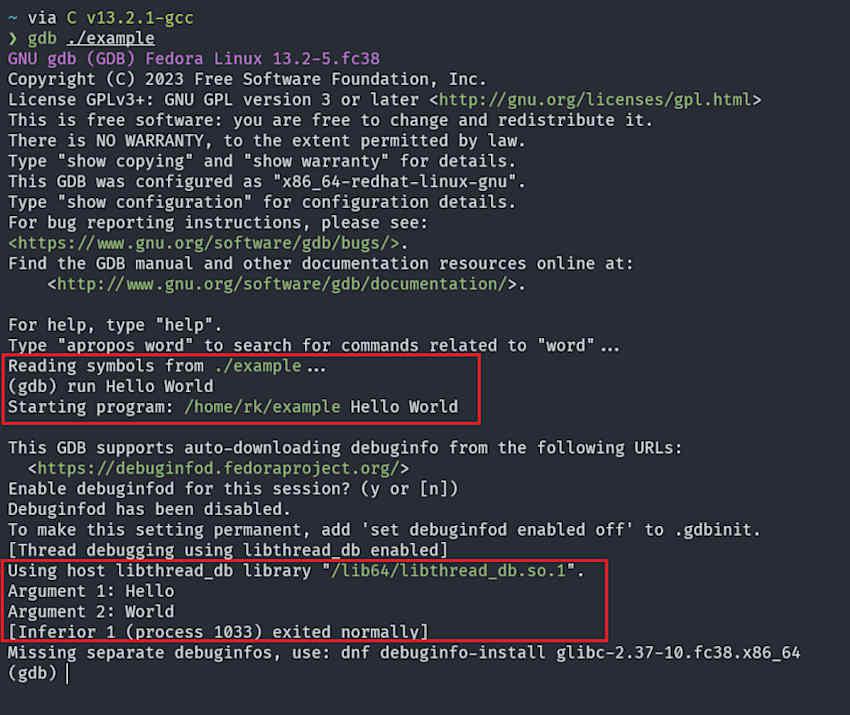
Output: run Hello World
Note: Entering arguments containing spaces
If your program’s path or any of the arguments contain spaces, enclose them in double quotes.
Example:
run "Hello GFG" "World"
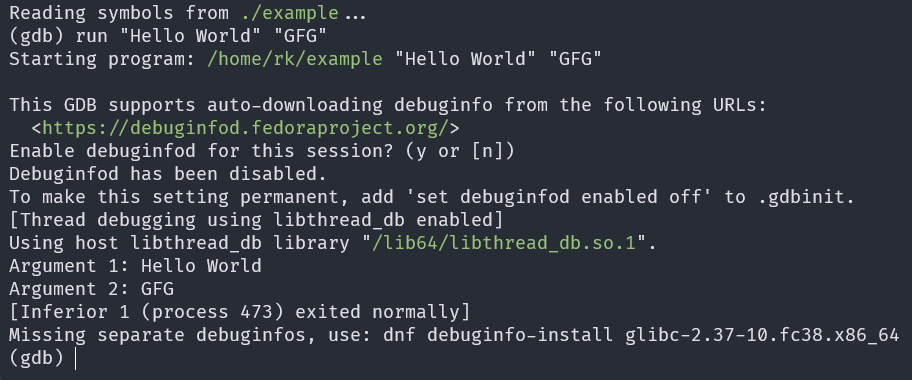
Entering arguments containing space
Step 5: Setting the breakpoint
Now that GDB is running your program with the specified command line arguments, you can set a breakpoint and start debugging.
Command:
break main
Explanation:
- break: This is a command used in the GDB environment to set breakpoints within your program. Breakpoints are specific points in your code where you want the program’s execution to pause for debugging.
- main: In this context, “main” refers to the main function of your program.

Setting breakpoint at beginning of the main function
Step 6: Start debugging the program
Now, type run to start debugging the program.The program will run until it reaches the breakpoint. You can then step through the code, inspect variables, and perform other debugging tasks.
Here are some commonly used commands for further navigation and debugging:
- next (or ‘n’): This command allows you to execute the next line of code in your program, skipping over function calls.
- step (or ‘s’): Use this command to step into functions, meaning you will move to the next line within the called function.
- continue (or ‘c’): It resumes the program’s execution until it encounters the next breakpoint or reaches the end.
- print (or ‘p’): This command lets you inspect the values of variables and expressions during debugging.
- info locals: Provides information about local variables in the current scope.
- backtrace (or ‘bt’): Displays a stack trace showing the sequence of function calls that led to the current point in the program.
- list: Shows a few lines of source code around the current execution point.
To learn more checkout this article on GDB commands.
These commands help you navigate through your program, inspect its state, and identify issues during the debugging process.
Here’s an example of the expected output. I am utilizing the ‘n’ (next) command to debug the entire program, proceeding line by line until it reaches the program’s end.
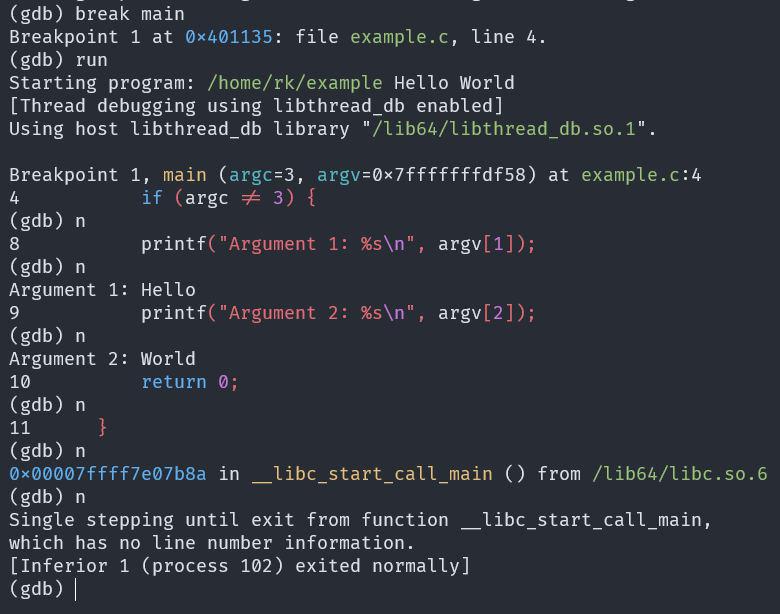
Complete debugging output
Step 7: Quit GDB
After debugging is complete, type quit to exit GDB.
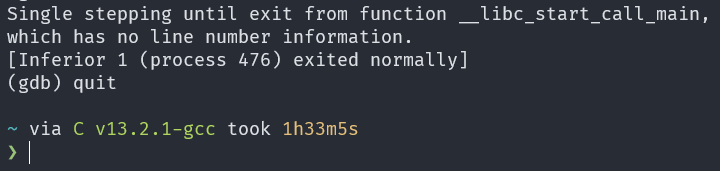
Exiting GDB using quit command
Conclusion
Passing command line arguments to GDB in a Linux environment is a straightforward process that allows you to set up your debugging sessions with specific initial conditions. By specifying the program’s path and appending the desired arguments, you can effectively debug your program with the input parameters you need. This capability is invaluable for diagnosing and fixing bugs, testing different scenarios, and improving the reliability of your software.
Share your thoughts in the comments
Please Login to comment...