Below is a program that shows undefined behavior when compiled using C99. 
Note: If an object that has automatic storage duration is not initialized explicitly, its value is indeterminate, where the indeterminate value is either an unspecified value or a trap representation.
Now compile the code. (here test.c). g flag means you can see the proper names of variables and functions in your stack frames, get line numbers and see the source as you step around in the executable. -std=C99 flag implies use standard C99 to compile the code. -o flag writes the build output to an output file.
gcc -std=c99 -g -o test test.C
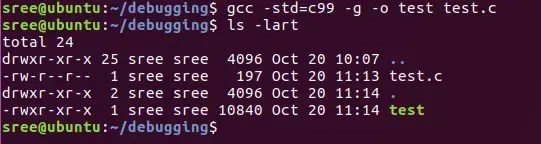
gcc -std=c99 -g -o test test.C
Run GDB with the generated executable
Type the following command to start GDB with the compiled executable.
gdb ./test

gdb ./test
Useful GDB commands:
Here are a few useful commands to get started with GDB.
| Executes the program from start to end. |
| Sets a breakpoint on a particular line. |
| Disables a breakpoint |
| Enables a disabled breakpoint. |
| Executes the next line of code without diving into functions. |
| Goes to the next instruction, diving into the function. |
| Displays the code. |
| Displays the value of a variable. |
| Exits out of GDB. |
| Clears all breakpoints. |
| Continues normal execution |
Display the code
Now, type “l” at gdb prompt to display the code.
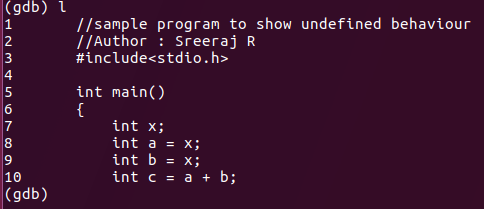
Display the code
Set a breakpoint
Let’s introduce a break point, say line 5.
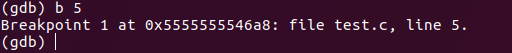
Set a breakpoint
If you want to put breakpoint at different lines, you can type “b line_number“.By default “list or l” display only first 10 lines.
View breakpoints
In order to see the breakpoints, type “info b”.
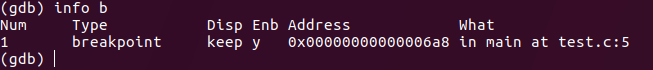
View breakpoints
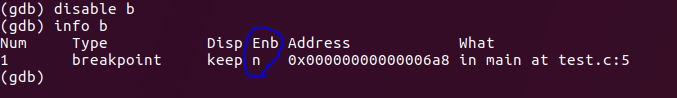
Disable a breakpoint
Having done the above, let’s say you changed your mind and you want to revert. Type “disable b”.
Disable a breakpoint
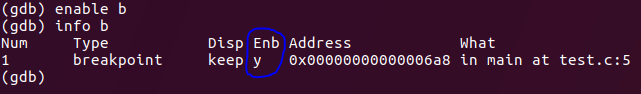
Re-enable a disabled breakpoint
As marked in the blue circle, Enb becomes n for disabled. 9. To re-enable the recent disabled breakpoint. Type “enable b”.
Re-enable a disabled breakpoint
Run the code
Run the code by typing “run or r”.If you haven’t set any breakpoints, the run command will simply execute the full program.

Run the code
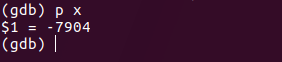
Print variable values
To see the value of variable, type “print variable_name or p variable_name“.
Print variable values
The above shows the values stored at x at time of execution.
Change variable values
To change the value of variable in gdb and continue execution with changed value, type “set variable_name“.
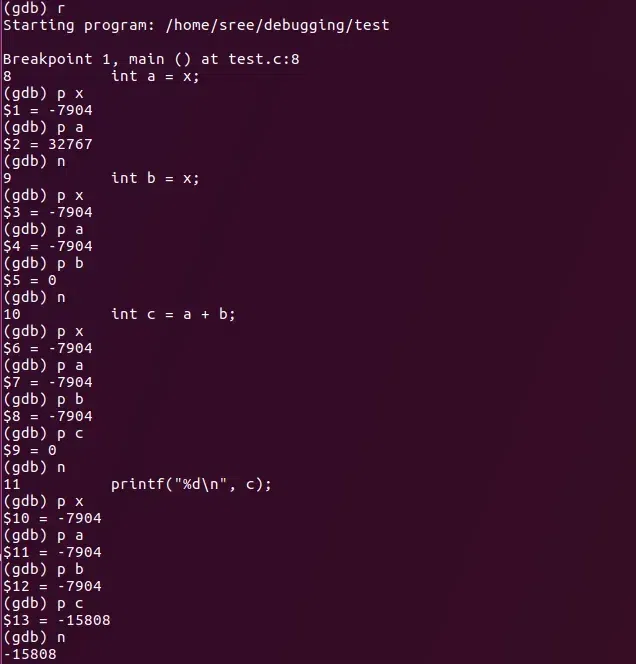
Debugging output
Below screenshot shows the values of variables from which it’s quite understandable the reason why we got a garbage value as output. At every execution of ./test we will be receiving a different output.
Exercise: Try using set x = 0 in gdb at first run and see the output of c.
Debugging output
GDB offers many more ways to debug and understand your code like examining stack, memory, threads, manipulating the program, etc. I hope the above example helps you get started with gdb.
Conclusion
In this article we have discussed GDB (GNU Debugger) which is a powerful tool in Linux used for debugging C programs. We have discussed some of the following steps so that we can compile your code with debugging information, run GDB, set breakpoint, examine variables, and analyze program behavior. We have also discussed GDB’s features, such as code examination, breakpoint management, variable manipulation, and program execution control which allow us to efficiently debug and issue resolution.
Like Article
Suggest improvement
Share your thoughts in the comments
Please Login to comment...